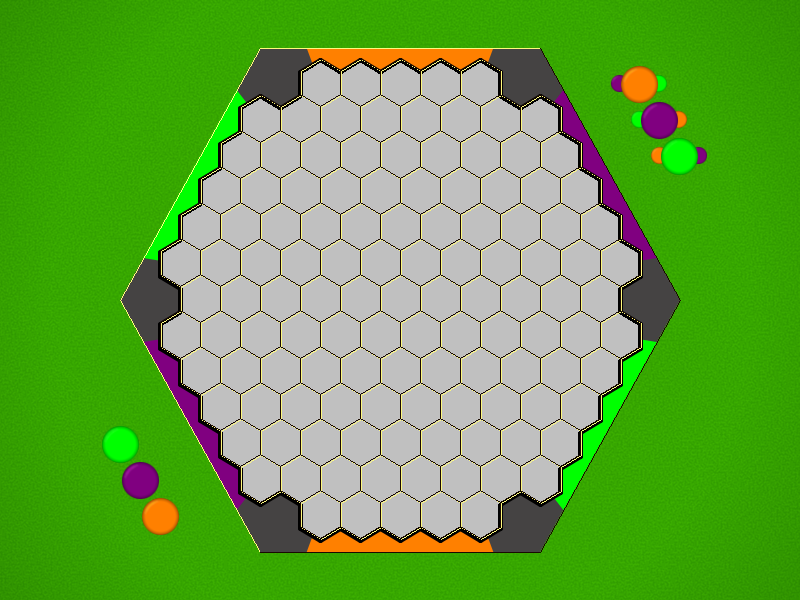
This tricky game requires you to connect opposite sides of the board: purple to purple, orange to orange, green to green. To make those connections, you must use the colour matching the sides you are connecting but your allied colour also works!
Generated at 12/05/2020, 01:53 from 1000 logged games.
Rules
Start Position
Play
On your turn, take a disc from the supply and place it on any empty space.
If you just formed a connection between opposite sides, with an uninterrupted chain of tiles of the sides' colour and/or the allied colour, you win that colour, even if the disc you placed formed a connection for both of you.
When you win a colour, take a disc of that colour from the supply and place it on the corresponding cell of your chart, while your opponent places a silver disc on the same colour on their chart (they lost that colour). If you just won your second colour, you win the game.
connection game get 2 out of 3 connections. each connection can use 2 colors
nestorgames
9
Kolomogorov Complexity Estimate
Size (bytes)
29652
Reference Size
10293
Ratio
2.88
Ai Ai calculates the size of the implementation, and compares it to the Ai Ai implementation of the simplest possible game (which just fills the board). Note that this estimate may include some graphics and heuristics code as well as the game logic. See the wikipedia entry for more details.
Playout Complexity Estimate
Playouts per second
2745.44 (364.24µs/playout)
Reference Size
390823.62 (2.56µs/playout)
Ratio (low is good)
142.35
Tavener complexity: the heat generated by playing every possible instance of a game with a perfectly efficient programme. Since this is not possible to calculate, Ai Ai calculates the number of random playouts per second and compares it to the fastest non-trivial Ai Ai game (Connect 4). This ratio gives a practical indication of how complex the game is. Combine this with the computational state space, and you can get an idea of how strong the default (MCTS-based) AI will be.
Playout/Search Speed
Label
Its/s
SD
Nodes/s
SD
Game length
SD
Random playout
4,255
184
410,587
17,708
97
9
search.UCB
4,302
110
74
7
search.UCT
4,309
133
76
6
Random: 10 second warmup for the hotspot compiler. 100 trials of 1000ms each.
Other: 100 playouts, means calculated over the first 5 moves only to avoid distortion due to speedup at end of game.
Mirroring Strategies
Rotation (Half turn) lost each game as expected.
Reflection (X axis) lost each game as expected.
Reflection (Y axis) lost each game as expected.
Copy last move lost each game as expected.
Mirroring strategies attempt to copy the previous move. On first move, they will attempt to play in the centre. If neither of these are possible, they will pick a random move. Each entry represents a different form of copying; direct copy, reflection in either the X or Y axis, half-turn rotation.
Win % By Player (Bias)
1: Player 1 win %
50.90±3.10
Includes draws = 50%
2: Player 2 win %
49.10±3.09
Includes draws = 50%
Draw %
0.00
Percentage of games where all players draw.
Decisive %
100.00
Percentage of games with a single winner.
Samples
1000
Quantity of logged games played
Note: that win/loss statistics may vary depending on thinking time (horizon effect, etc.), bad heuristics, bugs, and other factors, so should be taken with a pinch of salt. (Given perfect play, any game of pure skill will always end in the same result.)
Note: Ai Ai differentiates between states where all players draw or win or lose; this is mostly to support cooperative games.
Levels of Play
AI
Strong Wins
Draws
Strong Losses
#Games
Strong Win%
p1 Win%
Game Length
Random
Grand Unified UCT(U1-T,rSel=s, secs=0.01)
36
0
0
36
100.00
47.22
85.72
Grand Unified UCT(U1-T,rSel=s, secs=0.03)
36
0
6
42
85.71
59.52
80.02
Grand Unified UCT(U1-T,rSel=s, secs=0.07)
36
0
5
41
87.80
53.66
77.37
Grand Unified UCT(U1-T,rSel=s, secs=0.20)
36
0
1
37
97.30
67.57
71.59
Grand Unified UCT(U1-T,rSel=s, secs=0.55)
36
0
1
37
97.30
43.24
65.41
Level of Play: Strong beats Weak 60% of the time (lower bound with 90% confidence).
Draw%, p1 win% and game length may give some indication of trends as AI strength increases; but be aware that the AI can introduce bias due to horizon effects, poor heuristics, etc.
Complexity
Game length
69.82
Branching factor
259.78
Complexity
10^167.41
Based on game length and branching factor
Samples
1000
Quantity of logged games played
Computational complexity (where present) is an estimate of the game tree reachable through actual play. For each game in turn, Ai Ai marks the positions reached in a hashtable, then counts the number of new moves added to the table. Once all moves are applied, it treats this sequence as a geometric progression and calculates the sum as n-> infinity.
Move Classification
Distinct actions
363
Number of distinct moves (e.g. "e4") regardless of position in game tree
Good moves
176
A good move is selected by the AI more than the average
Bad moves
187
A bad move is selected by the AI less than the average
Samples
1000
Quantity of logged games played
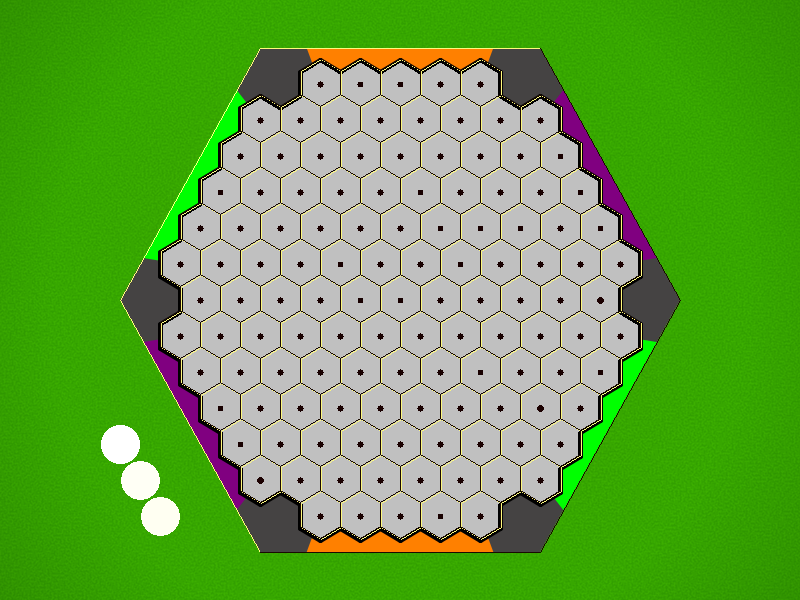
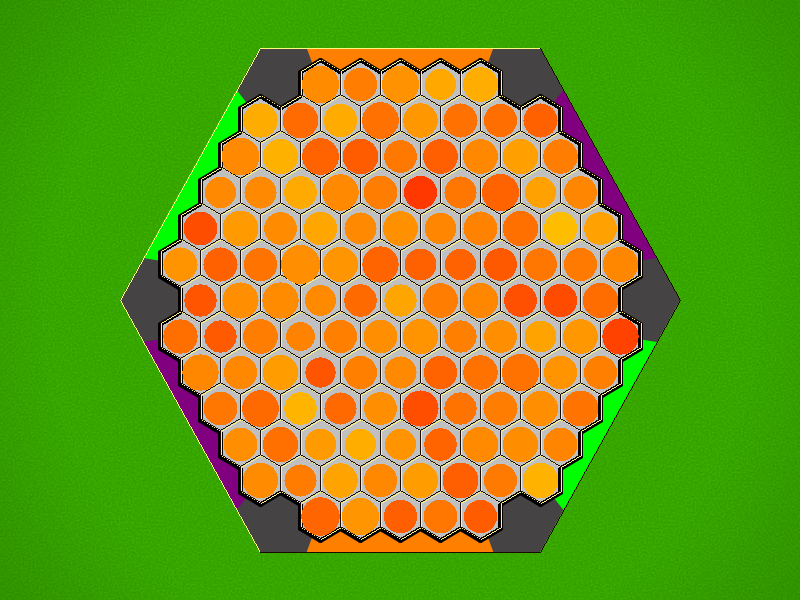
Board Coverage
A mean of 60.18% of board locations were used per game.
Colour shows the frequency of visits.
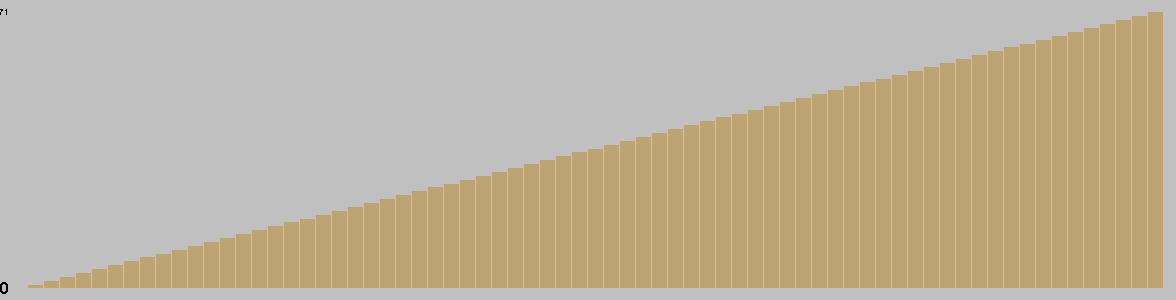
Change in Material Per Turn
This chart is based on a single playout, and gives a feel for the change in material over the course of a game.
Actions/turn
Table: branching factor per turn.
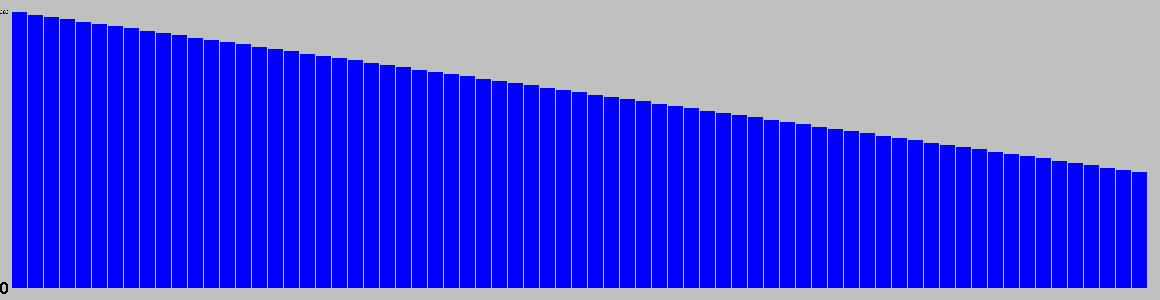
Action Types per Turn
This chart is based on a single playout, and gives a feel for the types of moves available over the course of a game.
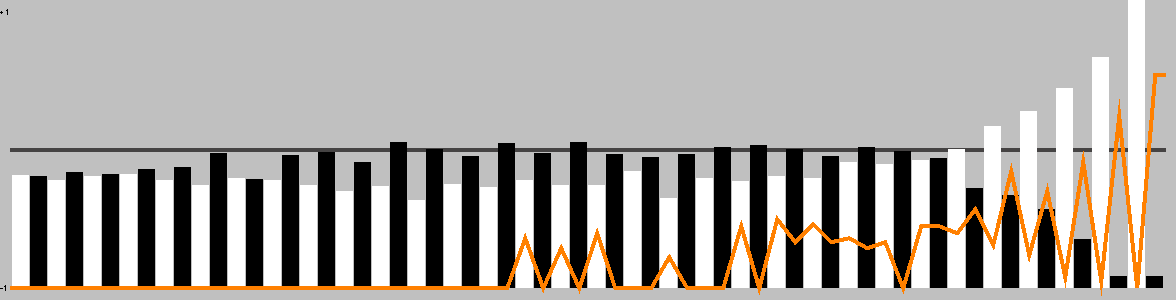
This chart shows the best move value with respect to the active player; the orange line represents the value of doing nothing (null move).
The lead changed on 82% of the game turns. Ai Ai found 0 critical turns (turns with only one good option).
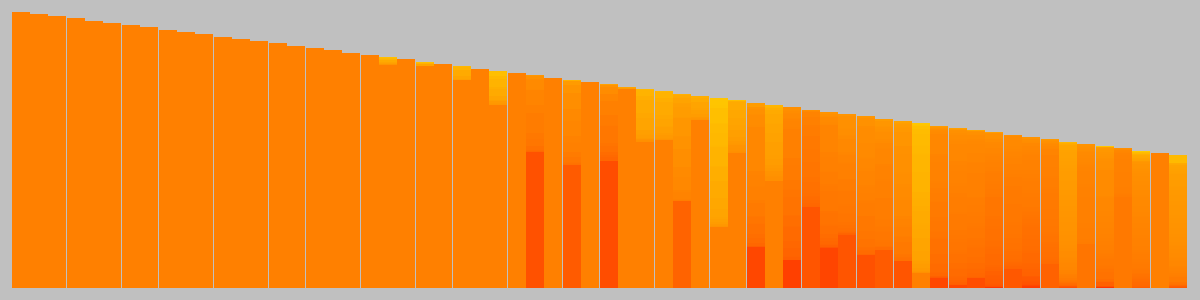
Position Heatmap
This chart shows the relative temperature of all moves each turn. Colour range: black (worst), red, orange(even), yellow, white(best).
Good/Effective moves
Measure
All players
Player 1
Player 2
Mean % of effective moves
1.65
3.12
0.18
Mean no. of effective moves
2.92
5.53
0.31
Effective game space
10^-∞
10^-∞
10^-∞
Mean % of good moves
3.41
0.00
6.82
Mean no. of good moves
6.06
0.00
12.12
Good move game space
10^6.59
10^0.00
10^6.59
These figures were calculated over a single game.
An effective move is one with score 0.1 of the best move (including the best move). -1 (loss) <= score <= 1 (win)
A good move has a score > 0. Note that when there are no good moves, an multiplier of 1 is used for the game space calculation.
Quality Measures
Measure
Value
Description
Hot turns
98.44%
A hot turn is one where making a move is better than doing nothing.
Momentum
48.44%
% of turns where a player improved their score.
Correction
39.06%
% of turns where the score headed back towards equality.
Depth
29.75%
Difference in evaluation between a short and long search.
Drama
0.00%
How much the winner was behind before their final victory.
Foulup Factor
0.00%
Moves that looked better than the best move after a short search.
Surprising turns
0.00%
Turns that looked bad after a short search, but good after a long one.
Last lead change
84.38%
Distance through game when the lead changed for the last time.
Decisiveness
4.69%
Distance from the result being known to the end of the game.
These figures were calculated over a single game, and based on the measures of quality described in "Automatic Generation and Evaluation of Recombination Games" (Cameron Browne, 2007).
Opening Heatmap
Colour shows the success ratio of this play over the first 10moves; black < red < yellow < white.
Size shows the frequency this move is played.
Unique Positions Reachable at Depth
0
1
2
3
1
363
65703
7841163
Note: most games do not take board rotation and reflection into consideration. Multi-part turns could be treated as the same or different depth depending on the implementation. Counts to depth N include all moves reachable at lower depths. Inaccuracies may also exist due to hash collisions, but Ai Ai uses 64-bit hashes so these will be a very small fraction of a percentage point.