Generated at 22/07/2021, 16:35 from 1000 logged games.
Rules
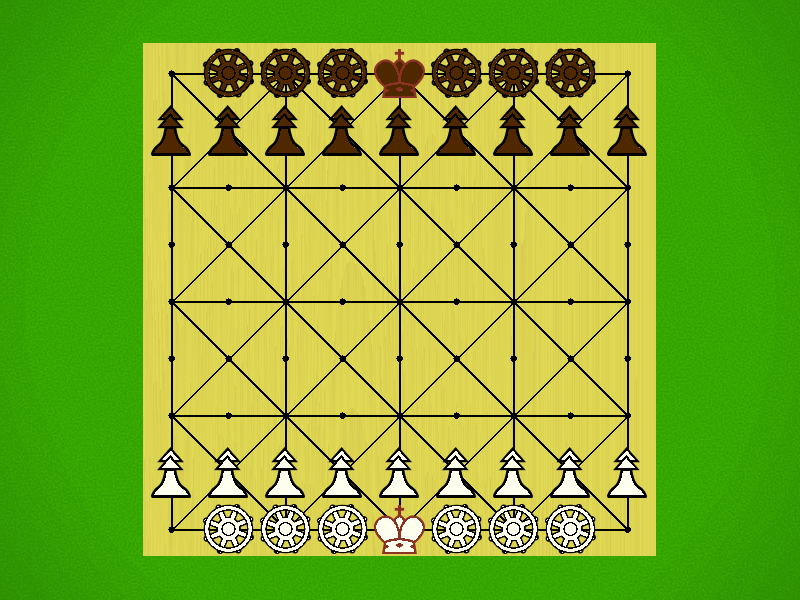
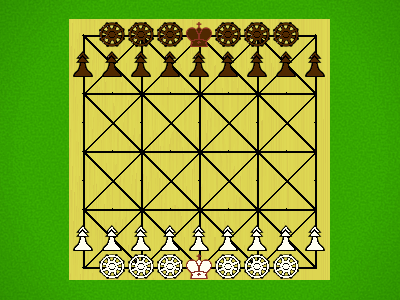
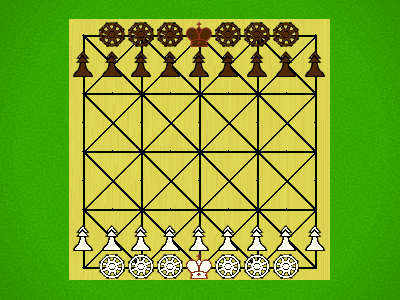
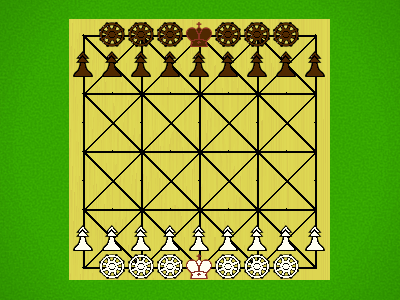
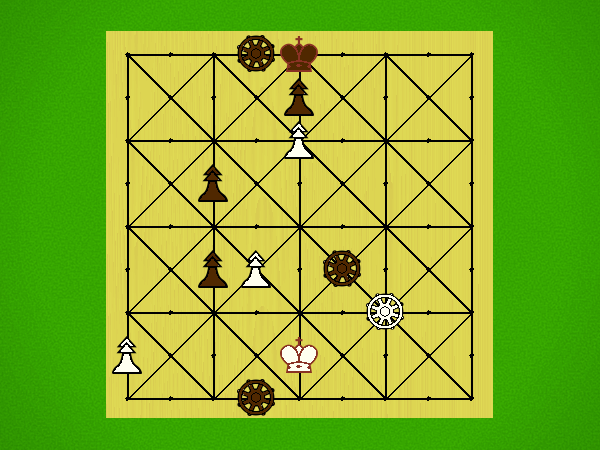
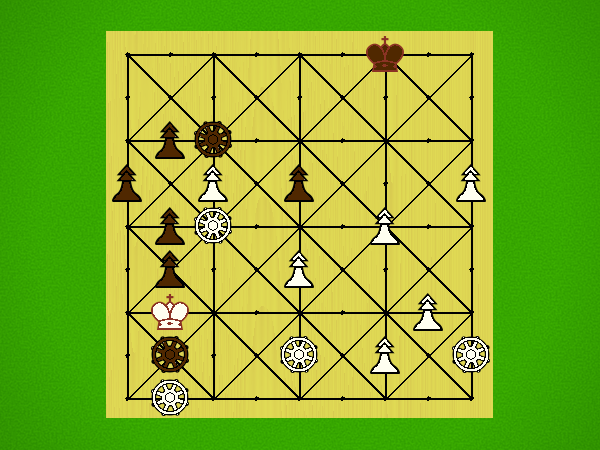
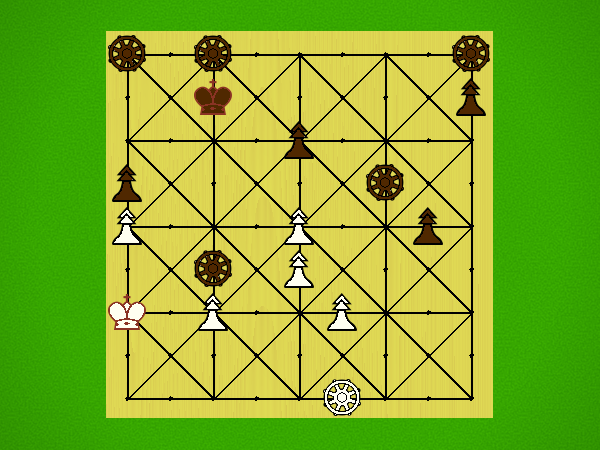
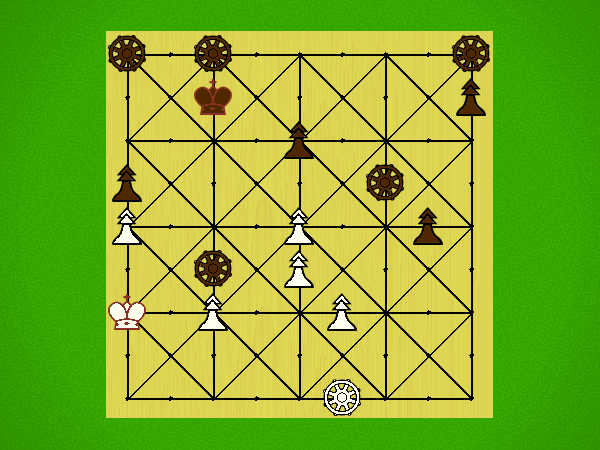
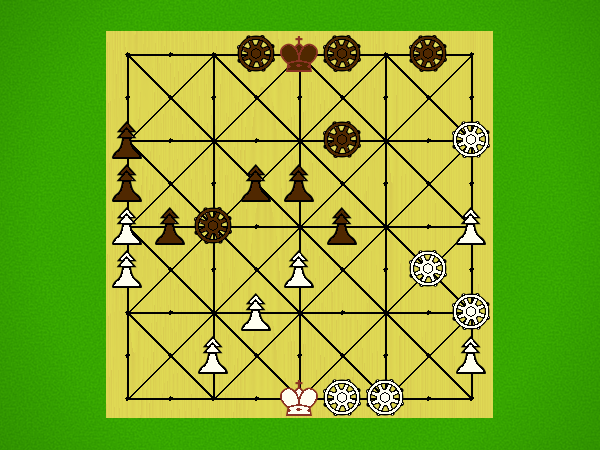
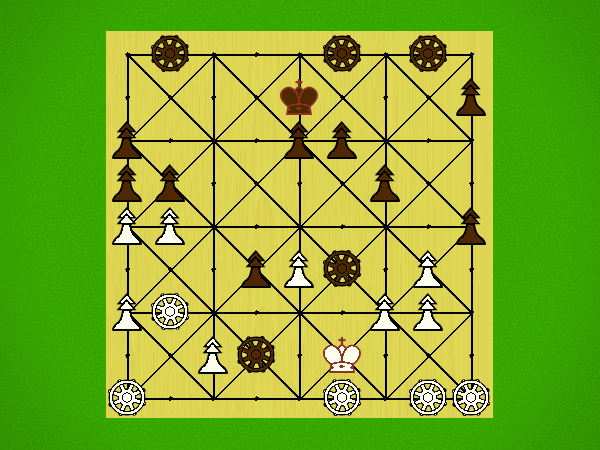
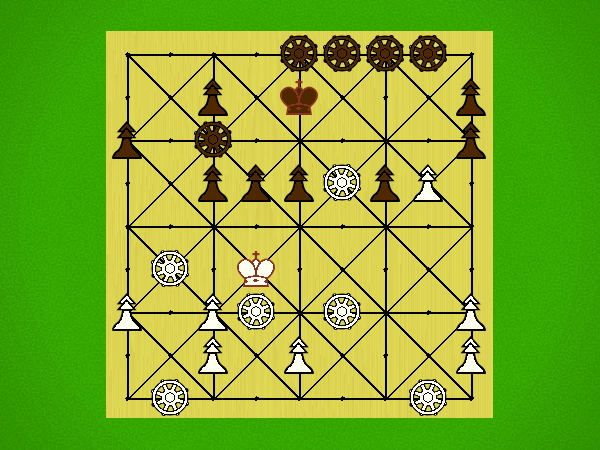
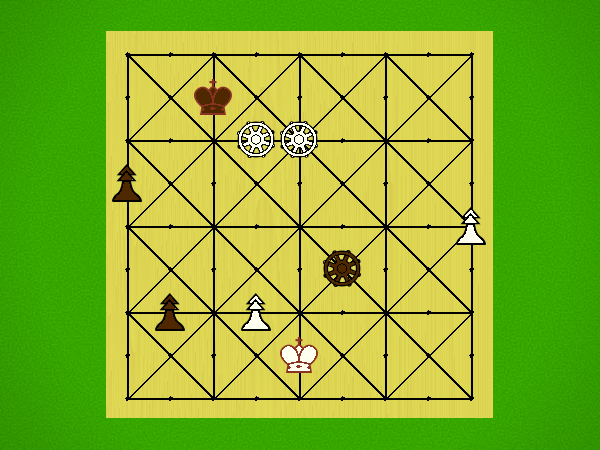
Representative game (in the sense of being of mean length). Wherever you see the 'representative game' referred to in later sections, this is it!
Goal
Checkmate the opponent's King.
Play
King
A King can move one step along a line in any direction. Like Chinese Chess, it has the special power to threaten the enemy King across the board along an empty line. For this reason, it is not permitted to make a move that leaves the two Kings facing each other with nothingin between. Unlike Chinese Chess, the King is not restricted to a particular area of the board. So it can threaten the enemy King along any line and in any direction.
Chariot
A Chariot can slide any number of spaces along a line in any direction.
Soldier
A Soldier can move one step along a line in any non-retreating direction. It can move two spaces from it's starting position, as long as it is not a capturing move. A Soldier promotes to a Chariot on the second to last rank.
Ai Ai calculates the size of the implementation, and compares it to the Ai Ai implementation of the simplest possible game (which just fills the board). Note that this estimate may include some graphics and heuristics code as well as the game logic. See the wikipedia entry for more details.
Playout Complexity Estimate
Playouts per second
145.64 (6866.17µs/playout)
Reference Size
738170.81 (1.35µs/playout)
Ratio (low is good)
5068.41
Tavener complexity: the heat generated by playing every possible instance of a game with a perfectly efficient programme. Since this is not possible to calculate, Ai Ai calculates the number of random playouts per second and compares it to the fastest non-trivial Ai Ai game (Connect 4). This ratio gives a practical indication of how complex the game is. Combine this with the computational state space, and you can get an idea of how strong the default (MCTS-based) AI will be.
Playout/Search Speed
Label
Its/s
SD
Nodes/s
SD
Game length
SD
Random playout
118
10
24,980
1,927
211
75
search.UCT
122
22
161
47
search.AlphaBeta
55,817
8,395
85
23
Random: 10 second warmup for the hotspot compiler. 100 trials of 1000ms each.
Other: 100 playouts, means calculated over the first 5 moves only to avoid distortion due to speedup at end of game.
Mirroring Strategies
Rotation (Half turn) lost each game as expected.
Reflection (X axis) lost each game as expected.
Reflection (Y axis) lost each game as expected.
Copy last move lost each game as expected.
Mirroring strategies attempt to copy the previous move. On first move, they will attempt to play in the centre. If neither of these are possible, they will pick a random move. Each entry represents a different form of copying; direct copy, reflection in either the X or Y axis, half-turn rotation.
Heuristic Values
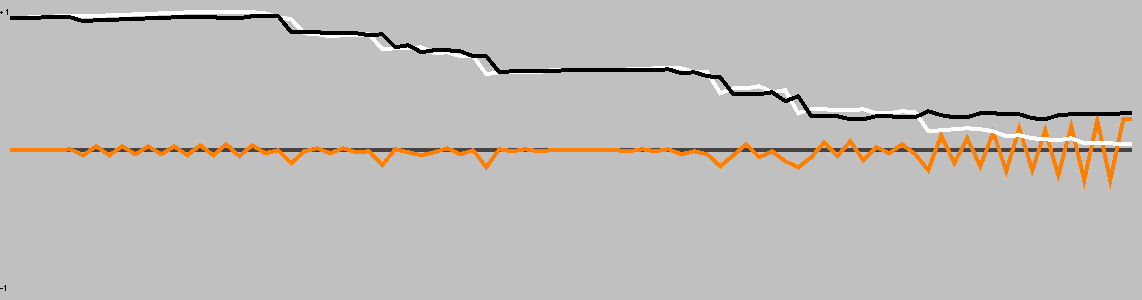
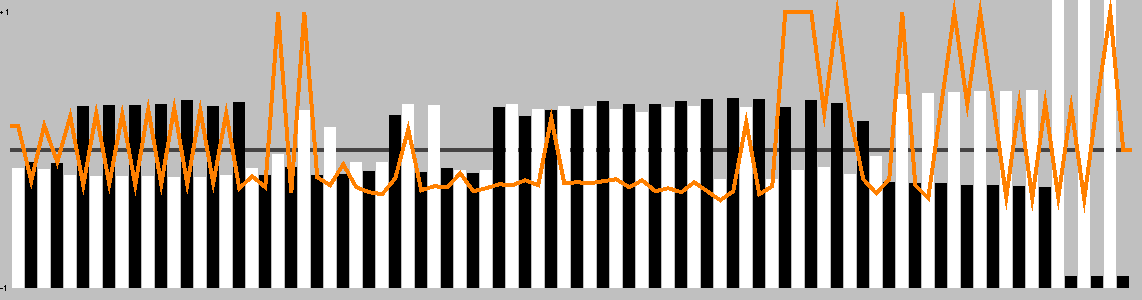
This chart shows the heuristic values thoughout a single representative* game. The orange line shows the difference between player scores. (* Representative, in the sense that it is close to the mean game length.)
Win % By Player (Bias)
1: White win %
48.70±3.09
Includes draws = 50%
2: Black win %
51.30±3.10
Includes draws = 50%
Draw %
2.40
Percentage of games where all players draw.
Decisive %
97.60
Percentage of games with a single winner.
Samples
1000
Quantity of logged games played
Note: that win/loss statistics may vary depending on thinking time (horizon effect, etc.), bad heuristics, bugs, and other factors, so should be taken with a pinch of salt. (Given perfect play, any game of pure skill will always end in the same result.)
Note: Ai Ai differentiates between states where all players draw or win or lose; this is mostly to support cooperative games.
UCT Skill Chains
Match
AI
Strong Wins
Draws
Strong Losses
#Games
Strong Score
p1 Win%
Draw%
p2 Win%
Game Length
0
Random
2
UCT (its=3)
587
88
259
934
0.6449 <= 0.6756 <= 0.7048
46.15
9.42
44.43
190.64
3
UCT (its=3)
505
52
443
1000
0.5000 <= 0.5310 <= 0.5618
47.20
5.20
47.60
180.68
Search for levels ended: time limit reached.
Level of Play: Strong beats Weak 60% of the time (lower bound with 95% confidence).
Draw%, p1 win% and game length may give some indication of trends as AI strength increases.
1st Player Win Ratios by Playing Strength
This chart shows the win(green)/draw(black)/loss(red) percentages, as UCT play strength increases. Note that for most games, the top playing strength show here will be distinctly below human standard.
Complexity
Game length
85.51
Branching factor
30.99
Complexity
10^118.53
Based on game length and branching factor
Samples
1000
Quantity of logged games played
Computational complexity (where present) is an estimate of the game tree reachable through actual play. For each game in turn, Ai Ai marks the positions reached in a hashtable, then counts the number of new moves added to the table. Once all moves are applied, it treats this sequence as a geometric progression and calculates the sum as n-> infinity.
Move Classification
Distinct actions
2902
Number of distinct moves (e.g. "e4") regardless of position in game tree
Killer moves
328
A 'killer' move is selected by the AI more than 50% of the time Too many killers to list.
Good moves
1777
A good move is selected by the AI more than the average
Bad moves
1110
A bad move is selected by the AI less than the average
Terrible moves
465
A terrible move is never selected by the AI Too many terrible moves to list.
Response distance
3.06
Mean distance between move and response; a low value relative to the board size may mean a game is tactical rather than strategic.
Samples
1000
Quantity of logged games played
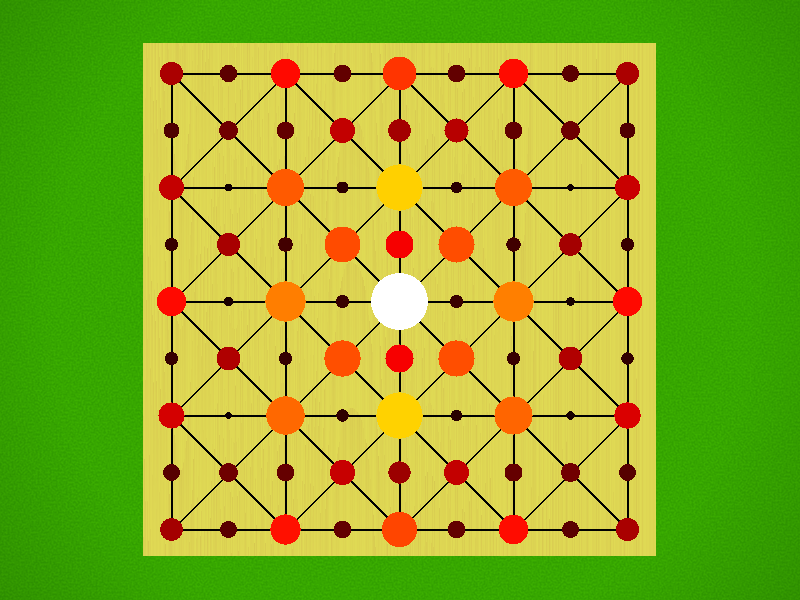
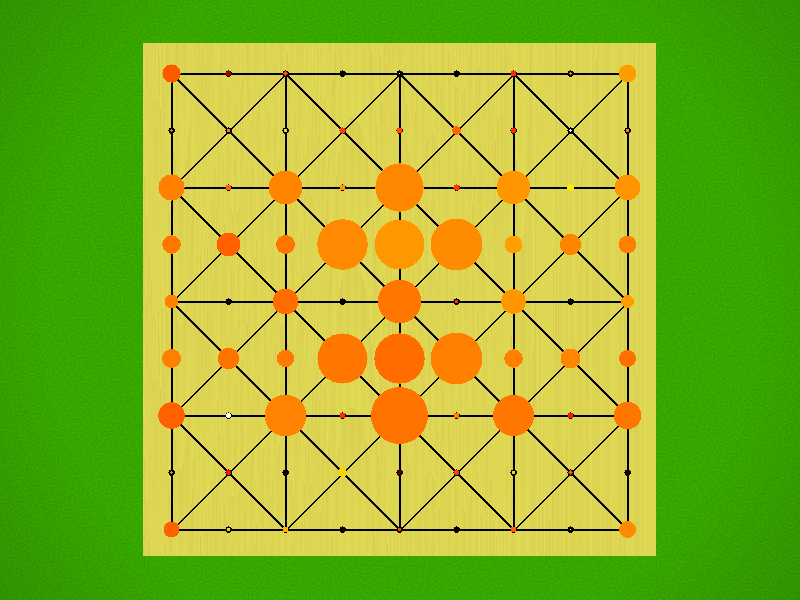
Board Coverage
A mean of 71.67% of board locations were used per game.
Colour and size show the frequency of visits.
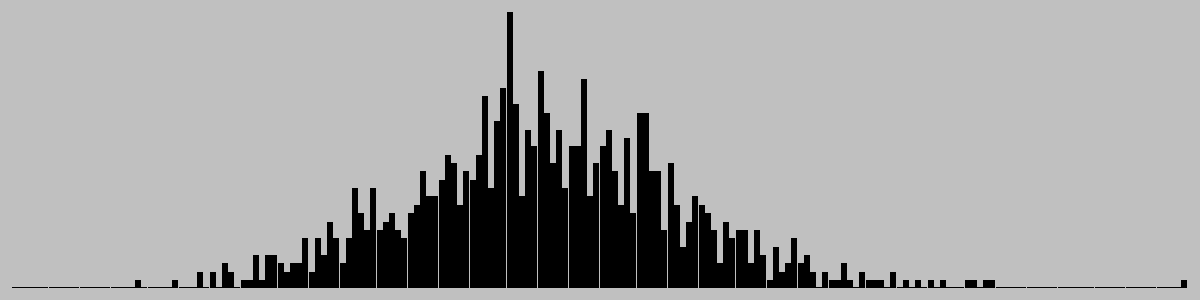
Game Length
Game length frequencies.
Mean
85.51
Mode
[80]
Median
85.0
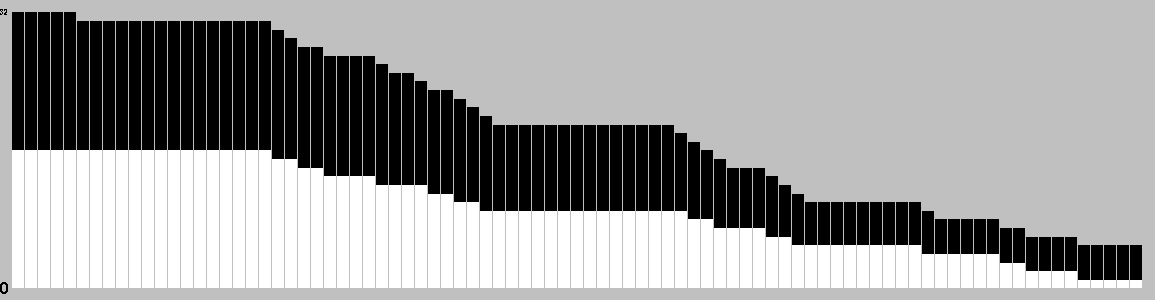
Change in Material Per Turn
This chart is based on a single representative* playout, and gives a feel for the change in material over the course of a game. (* Representative in the sense that it is close to the mean length.)
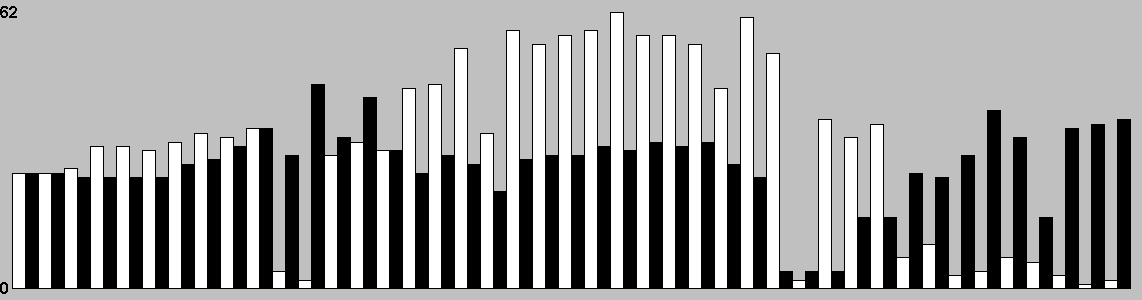
Actions/turn
Table: branching factor per turn, based on a single representative* game. (* Representative in the sense that it is close to the mean game length.)
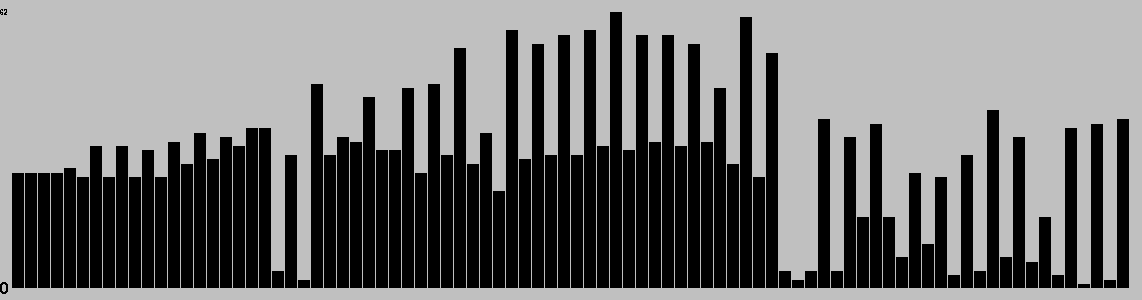
Action Types per Turn
This chart is based on a single representative* game, and gives a feel for the types of moves available throughout that game. (* Representative in the sense that it is close to the mean game length.)
This chart shows the best move value with respect to the active player; the orange line represents the value of doing nothing (null move).
The lead changed on 38% of the game turns. Ai Ai found 10 critical turns (turns with only one good option).
Position Heatmap
This chart shows the relative temperature of all moves each turn. Colour range: black (worst), red, orange(even), yellow, white(best).
Good/Effective moves
Measure
All players
Player 1
Player 2
Mean % of effective moves
71.56
76.91
66.21
Mean no. of effective moves
20.59
23.60
17.58
Effective game space
10^90.84
10^45.63
10^45.21
Mean % of good moves
36.02
45.55
26.49
Mean no. of good moves
10.27
12.74
7.79
Good move game space
10^56.28
10^33.74
10^22.54
These figures were calculated over a single game.
An effective move is one with score 0.1 of the best move (including the best move). -1 (loss) <= score <= 1 (win)
A good move has a score > 0. Note that when there are no good moves, an multiplier of 1 is used for the game space calculation.
Quality Measures
Measure
Value
Description
Hot turns
70.93%
A hot turn is one where making a move is better than doing nothing.
Momentum
20.93%
% of turns where a player improved their score.
Correction
34.88%
% of turns where the score headed back towards equality.
Depth
9.19%
Difference in evaluation between a short and long search.
Drama
6.43%
How much the winner was behind before their final victory.
Foulup Factor
83.72%
Moves that looked better than the best move after a short search.
Surprising turns
13.95%
Turns that looked bad after a short search, but good after a long one.
Last lead change
79.07%
Distance through game when the lead changed for the last time.
Decisiveness
6.98%
Distance from the result being known to the end of the game.
These figures were calculated over a single representative* game, and based on the measures of quality described in "Automatic Generation and Evaluation of Recombination Games" (Cameron Browne, 2007). (* Representative, in the sense that it is close to the mean game length.)
Openings
Moves
Animation
P d2-c3,P f8-e7,P c3-c4
P f2-d4,P i8-i7,Q g1-e3
P h2-i3,P d8-f6,P g2-g4
P i2-i4,P h8-i7,P d2-e3
P d2-f4,P h8-i7,P i2-i4
P i2-i3,P i8-i6,P i3-h3
P a2-a4,P f8-d6,P c2-c4
P c2-c3,P g8-g6,P f2-e3
P d2-c3,P b8-c7,P h2-f4
P d2-c3,P b8-a7,P a2-a4
P d2-e3,P d8-b6,P i2-i3
P d2-e3,P e8-e6,P f2-h4
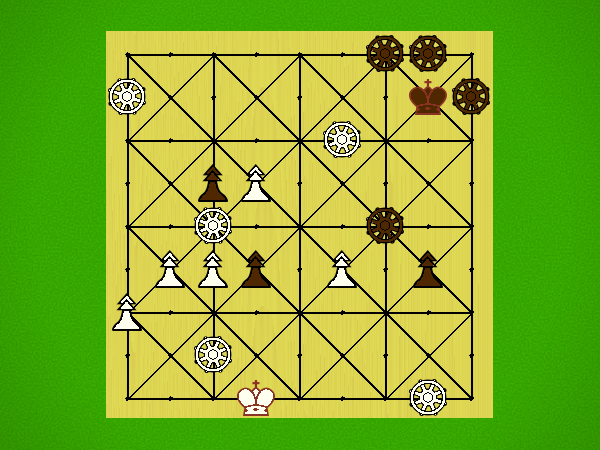
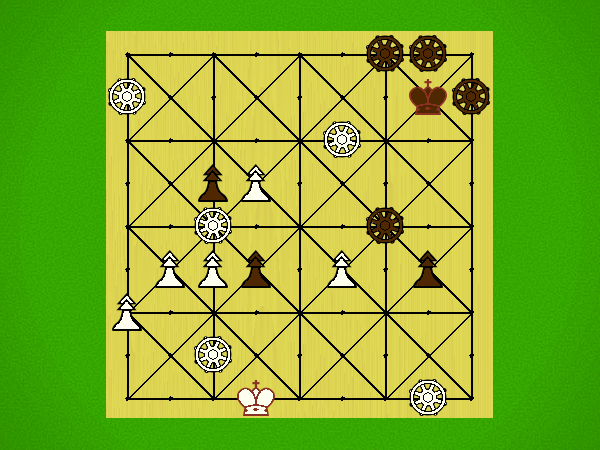
Opening Heatmap
Colour shows the success ratio of this play over the first 10moves; black < red < yellow < white.
Size shows the frequency this move is played.
Unique Positions Reachable at Depth
0
1
2
3
4
5
1
26
702
18690
310150
5370928
Note: most games do not take board rotation and reflection into consideration. Multi-part turns could be treated as the same or different depth depending on the implementation. Counts to depth N include all moves reachable at lower depths. Inaccuracies may also exist due to hash collisions, but Ai Ai uses 64-bit hashes so these will be a very small fraction of a percentage point.
Shortest Game(s)
No solutions found to depth 5.
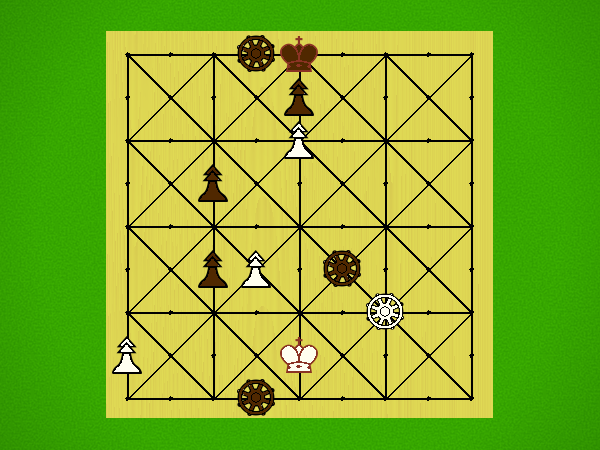
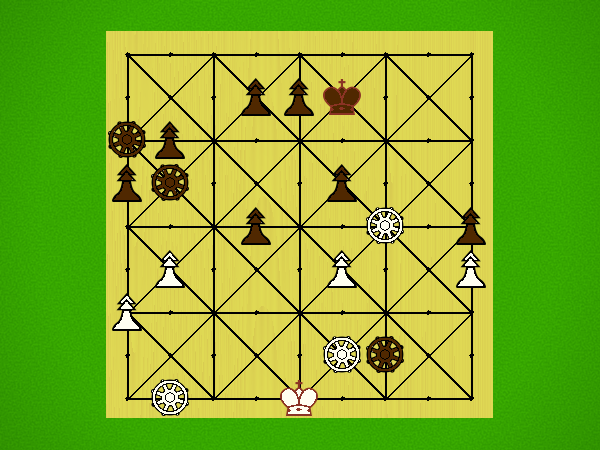
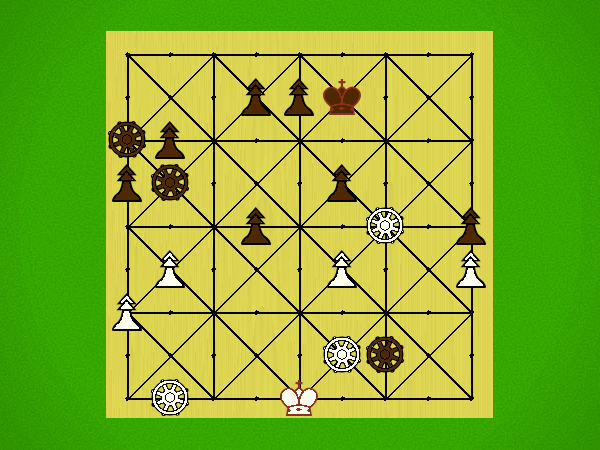
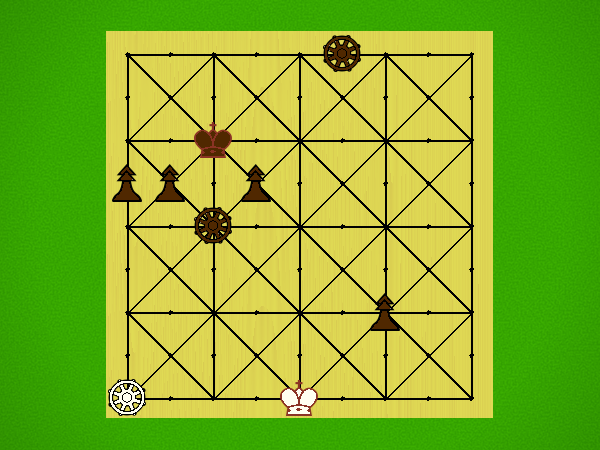
Puzzles
Puzzle
Solution
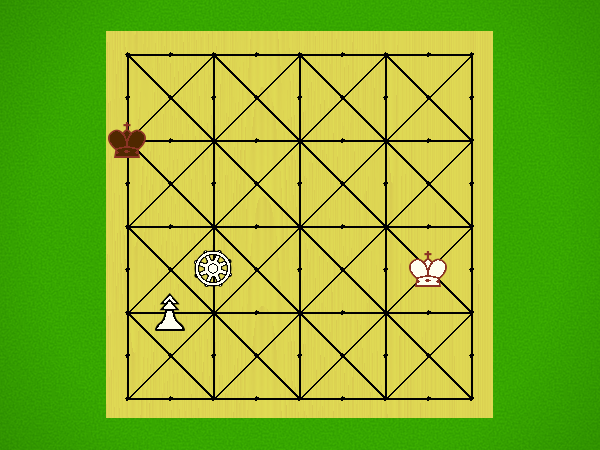
Black to win in 7 moves
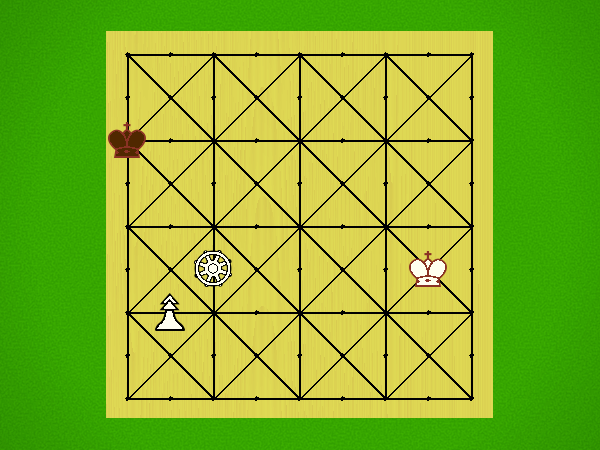
Black to win in 3 moves
Black to win in 3 moves
Black to win in 3 moves
White to win in 3 moves
Black to win in 3 moves
Black to win in 3 moves
White to win in 3 moves
Black to win in 3 moves
Black to win in 3 moves
Black to win in 3 moves
White to win in 3 moves
Weak puzzle selection criteria are in place; the first move may not be unique.