Full Report for Apart by Kanare Kato

Full Report for Apart by Kanare Kato

Apart is a game in which the goal is to distribute your pieces, as opposed to a game in which you create groups.

Generated at 2024-12-09, 13:19 from 1000 logged games.

Rules

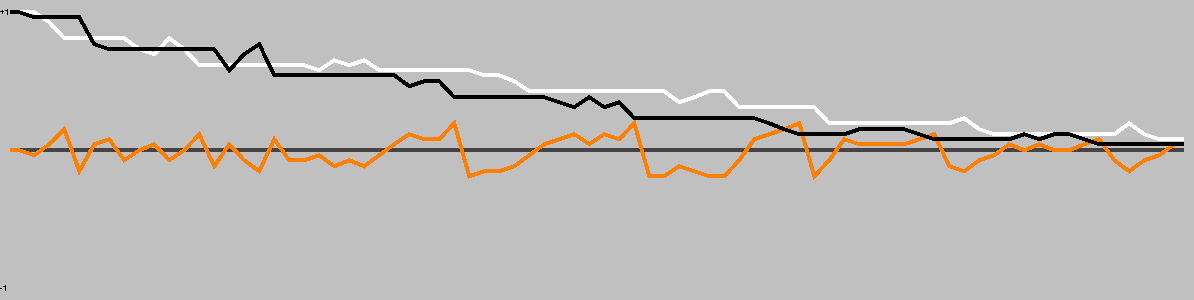
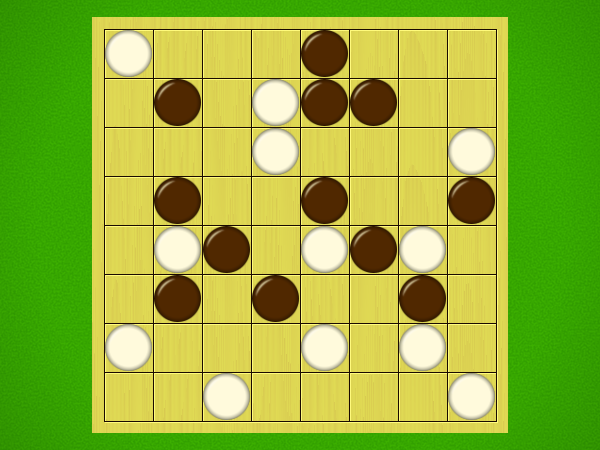
Representative game (in the sense of being of mean length). Wherever you see the 'representative game' referred to in later sections, this is it!

Definitions

Line
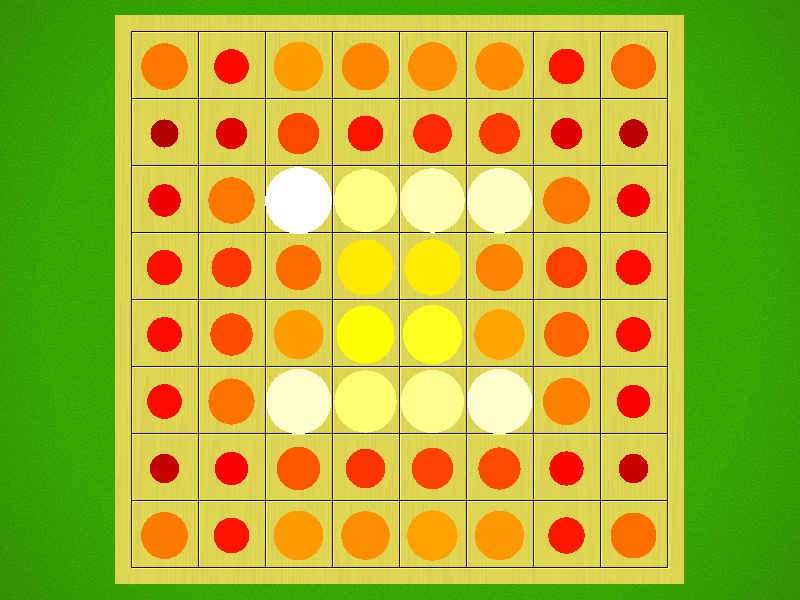
Same-colour pieces arranged in an unbroken straight line are called a line. The length of a line is the number of pieces belonging to that line. A row with only one piece in it is considered a line of length 1. Therefore, each piece belongs to multiple lines at any time.
Step
Moving a piece to an adjacent space is called a step.
Jump
Moving a piece two or more squares is called a jump.

Play

White plays first, then turns alternate; on White's first move, jumping more than once is not allowed.

Pieces move in straight lines, a distance exactly equal to the length of the line in that direction.

An enemy piece in the destination space is captured

If the move is a Jump (more than one space) then:

Game End

Play continues until a player separates all their pieces. They win.

Miscellaneous

General comments:

Play: Combinatorial

Family: Combinatorial 2023

Mechanism(s): Movement,Capture

Components: Board

Level: Advanced

BGG Stats

BGG EntryApart
BGG Ratingnull
#Votersnull
SDnull
BGG Weightnull
#Votersnull
Yearnull

Kolomogorov Complexity Analysis

Size (bytes)27309
Reference Size10915
Ratio2.50

Ai Ai calculates the size of the implementation, and compares it to the Ai Ai implementation of the simplest possible game (which just fills the board). Note that this estimate may include some graphics and heuristics code as well as the game logic. See the wikipedia entry for more details.

Playout Complexity Estimate

Playouts per second12666.38 (78.95µs/playout)
Reference Size411514.67 (2.43µs/playout)
Ratio (low is good)32.49

Tavener complexity: the heat generated by playing every possible instance of a game with a perfectly efficient programme. Since this is not possible to calculate, Ai Ai calculates the number of random playouts per second and compares it to the fastest non-trivial Ai Ai game (Connect 4). This ratio gives a practical indication of how complex the game is. Combine this with the computational state space, and you can get an idea of how strong the default (MCTS-based) AI will be.

State Space Complexity

% new positions/bucket

Samples1402834 
Confidence0.000: totally unreliable, 100: perfect

State space complexity (where present) is an estimate of the number of distinct game tree reachable through actual play. Over a series of random games, Ai Ai checks each position to see if it is new, or a repeat of a previous position and keeps a total for each game. As the number of games increase, the quantity of new positions seen per game decreases. These games are then partitioned into a number of buckets, and if certain conditions are met, Ai Ai treats the number in each bucket as the start of a strictly decreasing geometric sequence and sums it to estimate the total state space. The accuracy is calculated as 1-[end bucket count]/[starting bucklet count]

Playout/Search Speed

LabelIts/sSDNodes/sSDGame lengthSD
Random playout13,562491,985,5586,18614640
search.UCT14,03545011831
search.AlphaBeta196,84537,495708

Random: 10 second warmup for the hotspot compiler. 100 trials of 1000ms each.

Other: 100 playouts, means calculated over the first 5 moves only to avoid distortion due to speedup at end of game.

Mirroring Strategies

Rotation (Half turn) lost each game as expected.
Reflection (X axis) lost each game as expected.
Reflection (Y axis) lost each game as expected.
Copy last move lost each game as expected.

Mirroring strategies attempt to copy the previous move. On first move, they will attempt to play in the centre. If neither of these are possible, they will pick a random move. Each entry represents a different form of copying; direct copy, reflection in either the X or Y axis, half-turn rotation.

Heuristic Values

This chart shows the heuristic values thoughout a single representative* game. The orange line shows the difference between player scores. (* Representative, in the sense that it is close to the mean game length.)

Win % By Player (Bias)

1: White win %53.70±3.10Includes draws = 50%
2: Black win %46.30±3.07Includes draws = 50%
Draw %0.00Percentage of games where all players draw.
Decisive %100.00Percentage of games with a single winner.
Samples1000Quantity of logged games played

Note: that win/loss statistics may vary depending on thinking time (horizon effect, etc.), bad heuristics, bugs, and other factors, so should be taken with a pinch of salt. (Given perfect play, any game of pure skill will always end in the same result.)

Note: Ai Ai differentiates between states where all players draw or win or lose; this is mostly to support cooperative games.

UCT Skill Chains

MatchAIStrong WinsDrawsStrong Losses#GamesStrong Scorep1 Win%Draw%p2 Win%Game Length
0Random         
1UCT (its=2)631036910000.6006 <= 0.6310 <= 0.660448.500.0051.50147.37
6UCT (its=7)63103309610.6260 <= 0.6566 <= 0.686049.320.0050.68147.46
40UCT (its=109)6310717020.8743 <= 0.8989 <= 0.919051.280.0048.72144.78
41
UCT (its=296)
185
0
35
220
0.7868 <= 0.8409 <= 0.8833
49.55
0.00
50.45
141.75
42
UCT (its=296)
495
0
505
1000
0.4641 <= 0.4950 <= 0.5259
48.50
0.00
51.50
144.03

Search for levels ended: time limit reached.

Level of Play: Strong beats Weak 60% of the time (lower bound with 95% confidence).

Draw%, p1 win% and game length may give some indication of trends as AI strength increases.

1st Player Win Ratios by Playing Strength

This chart shows the win(green)/draw(black)/loss(red) percentages, as UCT play strength increases. Note that for most games, the top playing strength show here will be distinctly below human standard.

Complexity

Game length77.72 
Branching factor15.66 
Complexity10^53.00Based on game length and branching factor
Samples1000Quantity of logged games played

Computational complexity (where present) is an estimate of the game tree reachable through actual play. For each game in turn, Ai Ai marks the positions reached in a hashtable, then counts the number of new moves added to the table. Once all moves are applied, it treats this sequence as a geometric progression and calculates the sum as n-> infinity.

Move Classification

Board Size64Quantity of distinct board cells
Distinct actions1176Quantity of distinct moves (e.g. "e4") regardless of position in game tree
Killer moves173A 'killer' move is selected by the AI more than 50% of the time
Too many killers to list.
Good moves590A good move is selected by the AI more than the average
Bad moves586A bad move is selected by the AI less than the average
Terrible moves161A terrible move is never selected by the AI
Too many terrible moves to list.
Response distance%32.44%Distance from move to response / maximum board distance; a low value suggests a game is tactical rather than strategic.
Samples1000Quantity of logged games played

Board Coverage

A mean of 72.17% of board locations were used per game.

Colour and size show the frequency of visits.

Game Length

Game length frequencies.

Mean77.72
Mode[77]
Median77.0

Change in Material Per Turn

Mean change in material/round-0.39Complete round of play (all players)

This chart is based on a single representative* playout, and gives a feel for the change in material over the course of a game. (* Representative in the sense that it is close to the mean length.)

Actions/turn

Table: branching factor per turn, based on a single representative* game. (* Representative in the sense that it is close to the mean game length.)

Action Types per Turn

This chart is based on a single representative* game, and gives a feel for the types of moves available throughout that game. (* Representative in the sense that it is close to the mean game length.)

Red: removal, Black: move, Blue: Add, Grey: pass, Purple: swap sides, Brown: other.

Trajectory

This chart shows the best move value with respect to the active player; the orange line represents the value of doing nothing (null move).

The lead changed on 2% of the game turns. Ai Ai found 8 critical turns (turns with only one good option).

Position Heatmap

This chart shows the relative temperature of all moves each turn. Colour range: black (worst), red, orange(even), yellow, white(best).

Good/Effective moves

MeasureAll playersPlayer 1Player 2
Mean % of effective moves95.7692.9898.69
Mean no. of effective moves11.3611.4011.32
Effective game space10^49.4210^24.8410^24.57
Mean % of good moves17.5223.8210.90
Mean no. of good moves1.652.001.29
Good move game space10^9.8910^7.4310^2.46

These figures were calculated over a single game.

An effective move is one with score 0.1 of the best move (including the best move). -1 (loss) <= score <= 1 (win)

A good move has a score > 0. Note that when there are no good moves, an multiplier of 1 is used for the game space calculation.

Quality Measures

MeasureValueDescription
Hot turns19.23%A hot turn is one where making a move is better than doing nothing.
Momentum2.56%% of turns where a player improved their score.
Correction19.23%% of turns where the score headed back towards equality.
Depth1.18%Difference in evaluation between a short and long search.
Drama0.20%How much the winner was behind before their final victory.
Foulup Factor20.51%Moves that looked better than the best move after a short search.
Surprising turns1.28%Turns that looked bad after a short search, but good after a long one.
Last lead change5.13%Distance through game when the lead changed for the last time.
Decisiveness6.41%Distance from the result being known to the end of the game.

These figures were calculated over a single representative* game, and based on the measures of quality described in "Automatic Generation and Evaluation of Recombination Games" (Cameron Browne, 2007). (* Representative, in the sense that it is close to the mean game length.)

Openings

MovesAnimation
e1-g3,f8-d6,d6-g3,Pass,c1-e3,e3-e1,e1-a1,a1-c3,c3-e5,Pass
g1-g3,e7-c5,Pass,c1-c3,c3-c5,Pass,c7-e5,Pass,e2-g4,g4-g1
d2-d4,d8-b6,b6-b3,Pass,b1-h1,h1-f3,f3-d5,d5-d3,d3-f5,Pass
g1-g3,f8-d6,d6-b4,Pass,e2-g4,g4-g1,g1-a1,a1-c3,c3-c6,Pass
g2-a2,e8-c6,c6-c3,Pass,e1-c3,c3-a1,a1-a3,a3-a5,Pass,c8-e6
g1-e3,d7-f5,Pass,e2-g4,Pass,g8-a8,a8-c6,c6-e4,e4-g6,g6-g4
e2-c4,c8-e6,e6-e3,Pass,b1-h1,h1-f3,f3-d5,d5-b3,b3-b5,b5-d3
e2-c4,c8-c6,c6-c4,Pass,c2-c4,Pass,e8-a8,a8-c6,c6-c4,Pass
e1-g3,f8-d6,d6-g3,Pass,c1-e3,e3-e1,e1-a1,a1-c3,c3-e5
g1-g3,e7-c5,Pass,c1-c3,c3-c5,Pass,c7-e5,Pass,e2-g4
d2-d4,d8-b6,b6-b3,Pass,b1-h1,h1-f3,f3-d5,d5-d3,d3-f5
g1-g3,f8-d6,d6-b4,Pass,e2-g4,g4-g1,g1-a1,a1-c3,c3-c6

Opening Heatmap

Colour shows the success ratio of this play over the first 10moves; black < red < yellow < white.

Size shows the frequency this move is played.

Unique Positions Reachable at Depth

01234567
14016401397214103859048324220108520504

Note: most games do not take board rotation and reflection into consideration.
Multi-part turns could be treated as the same or different depth depending on the implementation.
Counts to depth N include all moves reachable at lower depths.
Inaccuracies may also exist due to hash collisions, but Ai Ai uses 64-bit hashes so these will be a very small fraction of a percentage point.

Shortest Game(s)

No solutions found to depth 7.

Puzzles

PuzzleSolution

White to win in 13 moves

Black to win in 12 moves

White to win in 11 moves

White to win in 12 moves

Weak puzzle selection criteria are in place; the first move may not be unique.