Full Report for Arrows by Stephen Tavener

Full Report for Arrows by Stephen Tavener

Last to make a legal move loses.

Generated at 08/10/2020, 17:20 from 370503 logged games.

Rules

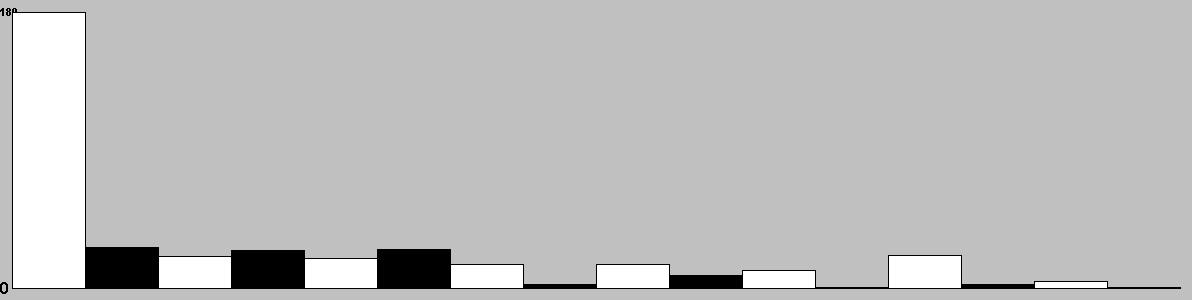
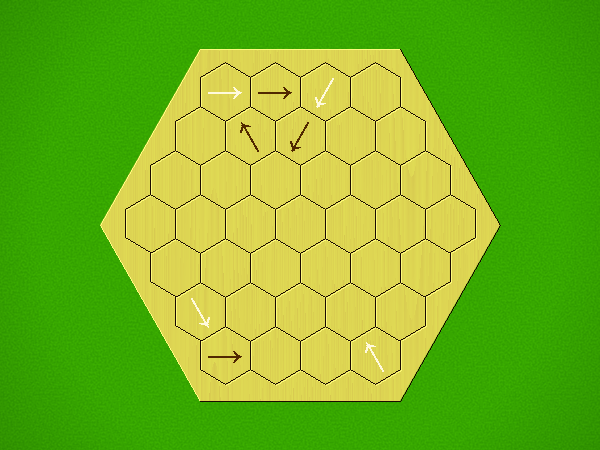
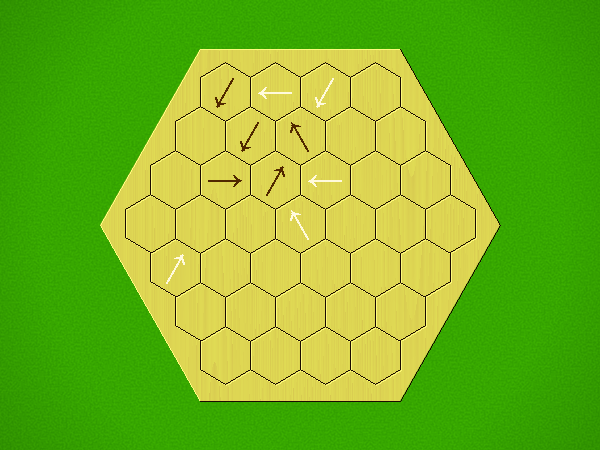
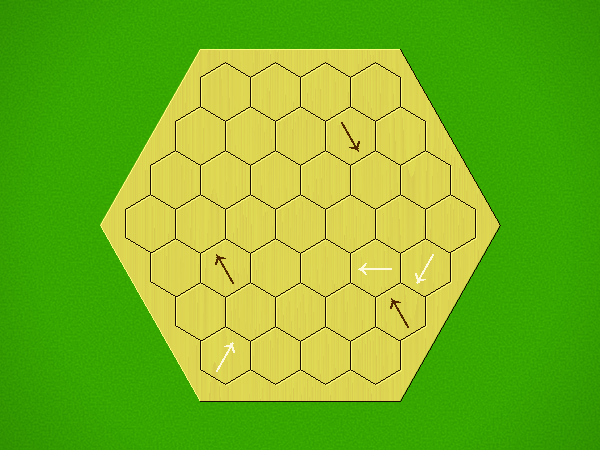
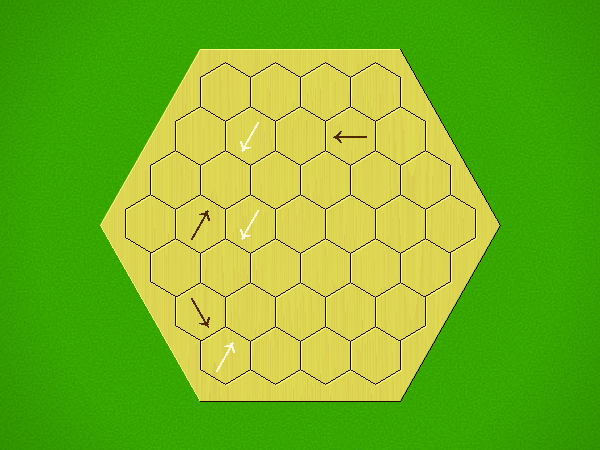
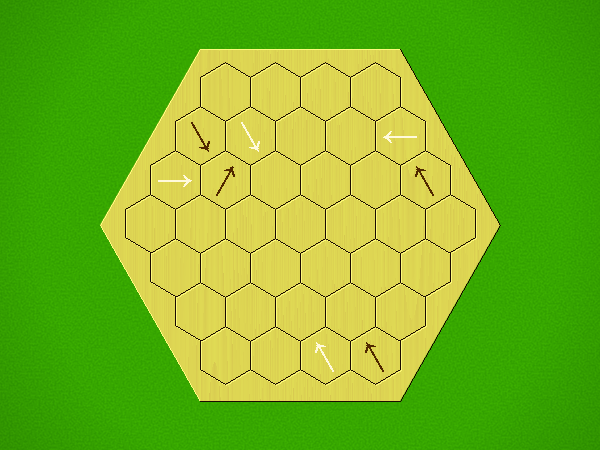
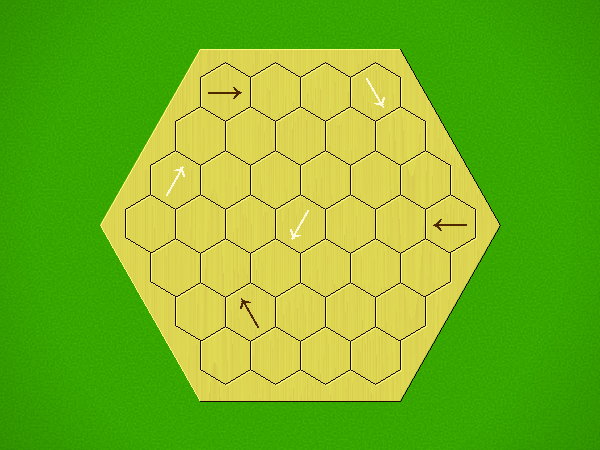
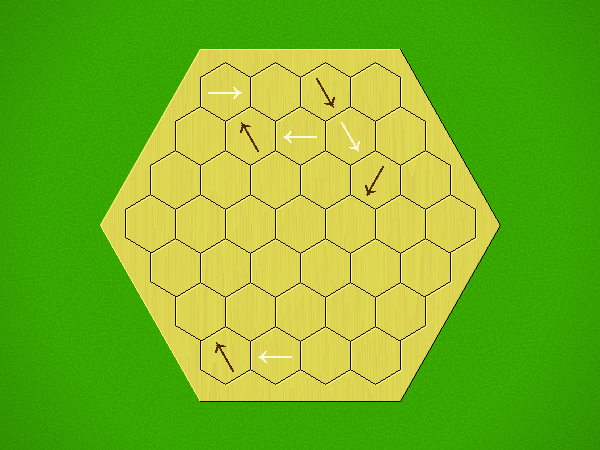
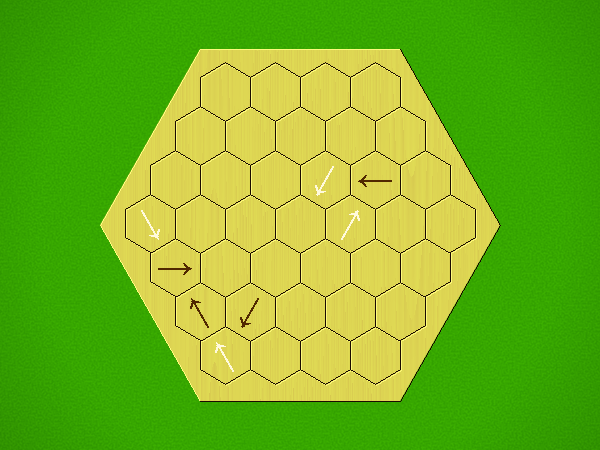
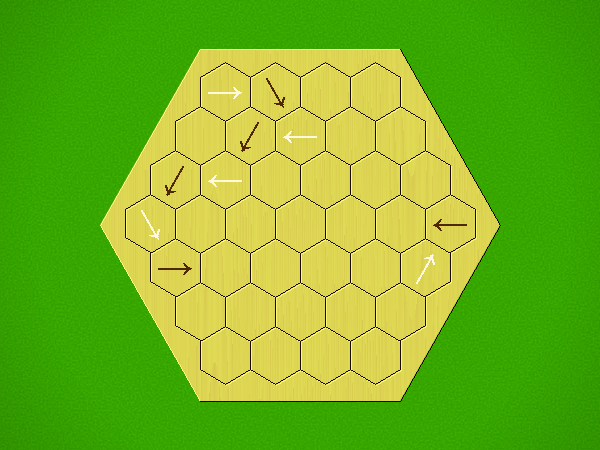
Representative game (in the sense of being of mean length). Wherever you see the 'representative game' referred to in later sections, this is it!

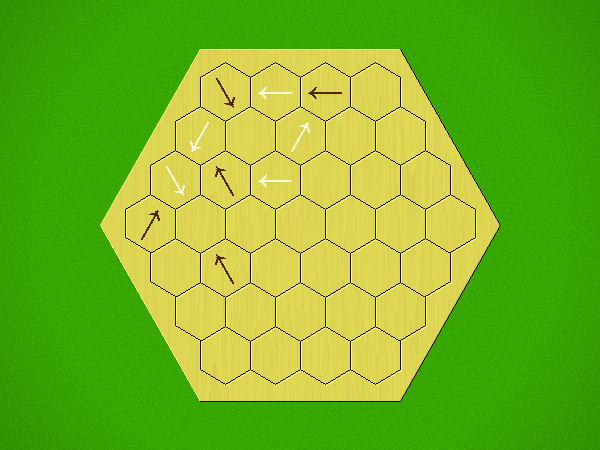
Each turn, add an arrow to the board, and point towards an empty space.

Your opponent must place a piece on an empty space in the direction indicated by the last arrow played (obstructions break the line).

If you play so that your opponent cannot make a legal move, you lose.

If you play so that your arrow points at a piece of your colour, you lose.

Miscellaneous

General comments:

Play: Combinatorial

Mechanism(s): Strict Placement

BGG Stats

BGG EntryArrows
BGG Ratingnull
#Votersnull
SDnull
BGG Weightnull
#Votersnull
Yearnull

Kolomogorov Complexity Analysis

Size (bytes)22322
Reference Size10293
Ratio2.17

Ai Ai calculates the size of the implementation, and compares it to the Ai Ai implementation of the simplest possible game (which just fills the board). Note that this estimate may include some graphics and heuristics code as well as the game logic. See the wikipedia entry for more details.

Playout Complexity Estimate

Playouts per second77689.82 (12.87µs/playout)
Reference Size386055.67 (2.59µs/playout)
Ratio (low is good)4.97

Tavener complexity: the heat generated by playing every possible instance of a game with a perfectly efficient programme. Since this is not possible to calculate, Ai Ai calculates the number of random playouts per second and compares it to the fastest non-trivial Ai Ai game (Connect 4). This ratio gives a practical indication of how complex the game is. Combine this with the computational state space, and you can get an idea of how strong the default (MCTS-based) AI will be.

Playout/Search Speed

LabelIts/sSDNodes/sSDGame lengthSD
Random playout217,7374,1402,462,39546,534114
search.UCB414,175138,071185
search.UCT304,41174,765184

Random: 10 second warmup for the hotspot compiler. 100 trials of 1000ms each.

Other: 100 playouts, means calculated over the first 5 moves only to avoid distortion due to speedup at end of game.

Mirroring Strategies

Rotation (Half turn) lost each game as expected.
Reflection (X axis) lost each game as expected.
Reflection (Y axis) lost each game as expected.
Copy last move lost each game as expected.

Mirroring strategies attempt to copy the previous move. On first move, they will attempt to play in the centre. If neither of these are possible, they will pick a random move. Each entry represents a different form of copying; direct copy, reflection in either the X or Y axis, half-turn rotation.

Win % By Player (Bias)

1: White win %44.88±0.16Includes draws = 50%
2: Black win %55.12±0.16Includes draws = 50%
Draw %0.00Percentage of games where all players draw.
Decisive %100.00Percentage of games with a single winner.
Samples370503Quantity of logged games played

Note: that win/loss statistics may vary depending on thinking time (horizon effect, etc.), bad heuristics, bugs, and other factors, so should be taken with a pinch of salt. (Given perfect play, any game of pure skill will always end in the same result.)

Note: Ai Ai differentiates between states where all players draw or win or lose; this is mostly to support cooperative games.

UCT Skill Chains

MatchAIStrong WinsDrawsStrong Losses#GamesStrong Scorep1 Win%Draw%p2 Win%Game Length
0Random         
1UCT (its=2)63103089390.6413 <= 0.6720 <= 0.701345.050.0054.9512.01
3UCT (its=4)63103199500.6336 <= 0.6642 <= 0.693544.840.0055.1614.44
9UCT (its=10)63103289590.6274 <= 0.6580 <= 0.687347.240.0052.7616.68
18UCT (its=19)63103269570.6287 <= 0.6594 <= 0.688747.650.0052.3517.45
30UCT (its=31)63103579880.6082 <= 0.6387 <= 0.668046.660.0053.3416.90
53UCT (its=54)63103409710.6193 <= 0.6498 <= 0.679246.860.0053.1416.06
94UCT (its=95)63103479780.6147 <= 0.6452 <= 0.674647.030.0052.9716.00
148UCT (its=149)631036910000.6006 <= 0.6310 <= 0.660444.100.0055.9016.23
180UCT (its=489)63101878180.7414 <= 0.7714 <= 0.798945.480.0054.5215.61
181UCT (its=1330)63102438740.6913 <= 0.7220 <= 0.750747.140.0052.8615.58
182UCT (its=3615)63102198500.7119 <= 0.7424 <= 0.770643.290.0056.7115.48
183UCT (its=9828)63101968270.7328 <= 0.7630 <= 0.790746.070.0053.9315.72
184UCT (its=26714)63101397700.7907 <= 0.8195 <= 0.845048.310.0051.6916.40
185UCT (its=72617)63101818120.7472 <= 0.7771 <= 0.804445.940.0054.0617.25
186
UCT (its=72617)
477
0
523
1000
0.4462 <= 0.4770 <= 0.5080
44.50
0.00
55.50
17.66

Search for levels ended: time limit reached.

Level of Play: Strong beats Weak 60% of the time (lower bound with 95% confidence).

Draw%, p1 win% and game length may give some indication of trends as AI strength increases.

1st Player Win Ratios by Playing Strength

This chart shows the win(green)/draw(black)/loss(red) percentages, as UCT play strength increases. Note that for most games, the top playing strength show here will be distinctly below human standard.

Complexity

Game length16.33 
Branching factor21.20 
Complexity10^14.20Based on game length and branching factor
Computational Complexity10^7.87Sample quality (100 best): 38.65
Samples370503Quantity of logged games played

Computational complexity (where present) is an estimate of the game tree reachable through actual play. For each game in turn, Ai Ai marks the positions reached in a hashtable, then counts the number of new moves added to the table. Once all moves are applied, it treats this sequence as a geometric progression and calculates the sum as n-> infinity.

Move Classification

Distinct actions181Number of distinct moves (e.g. "e4") regardless of position in game tree
Good moves66A good move is selected by the AI more than the average
Bad moves114A bad move is selected by the AI less than the average
Response distance1.82Mean distance between move and response; a low value relative to the board size may mean a game is tactical rather than strategic.
Samples370503Quantity of logged games played

Board Coverage

A mean of 43.55% of board locations were used per game.

Colour and size show the frequency of visits.

Game Length

Game length frequencies.

Mean16.33
Mode[15]
Median16.0

Change in Material Per Turn

This chart is based on a single representative* playout, and gives a feel for the change in material over the course of a game. (* Representative in the sense that it is close to the mean length.)

Actions/turn

Table: branching factor per turn, based on a single representative* game. (* Representative in the sense that it is close to the mean game length.)

Action Types per Turn

This chart is based on a single representative* game, and gives a feel for the types of moves available throughout that game. (* Representative in the sense that it is close to the mean game length.)

Red: removal, Black: move, Blue: Add, Grey: pass, Purple: swap sides, Brown: other.

Trajectory

This chart shows the best move value with respect to the active player; the orange line represents the value of doing nothing (null move).

The lead changed on 6% of the game turns. Ai Ai found 3 critical turns (turns with only one good option).

Position Heatmap

This chart shows the relative temperature of all moves each turn. Colour range: black (worst), red, orange(even), yellow, white(best).

Good/Effective moves

MeasureAll playersPlayer 1Player 2
Mean % of effective moves49.6923.4475.93
Mean no. of effective moves6.256.885.62
Effective game space10^9.2710^4.5410^4.74
Mean % of good moves8.119.516.72
Mean no. of good moves1.561.381.75
Good move game space10^2.9110^1.1810^1.73

These figures were calculated over a single game.

An effective move is one with score 0.1 of the best move (including the best move). -1 (loss) <= score <= 1 (win)

A good move has a score > 0. Note that when there are no good moves, an multiplier of 1 is used for the game space calculation.

Quality Measures

MeasureValueDescription
Hot turns43.75%A hot turn is one where making a move is better than doing nothing.
Momentum0.00%% of turns where a player improved their score.
Correction12.50%% of turns where the score headed back towards equality.
Depth6.72%Difference in evaluation between a short and long search.
Drama0.45%How much the winner was behind before their final victory.
Foulup Factor18.75%Moves that looked better than the best move after a short search.
Surprising turns0.00%Turns that looked bad after a short search, but good after a long one.
Last lead change37.50%Distance through game when the lead changed for the last time.
Decisiveness62.50%Distance from the result being known to the end of the game.

These figures were calculated over a single representative* game, and based on the measures of quality described in "Automatic Generation and Evaluation of Recombination Games" (Cameron Browne, 2007). (* Representative, in the sense that it is close to the mean game length.)

Openings

MovesAnimation
e1NE,e6SW,e2NW,a6SE,c4W,b4NW,a5SW,a4SE,c2SE,d1NE
e1NE,e6SW,e2NW,a6SE,c4W,a4SE,c2SE,d1NE,d3SW,d2NW
e1NE,e6W,a6SE,f1NE,f5W,a5E,b5SE,e2NW,c4SE,d3E
e1NE,e6W,a6SE,f1NE,f5W,a5E,e5W,b5E,d5W,c5SE
e1NE,e6W,a6SE,f1NE,f5W,a5E,e5W,b5E,d5W,c5SW
e1NE,e6W,a6SE,f1NE,f5W,a5E,e5W,b5SW,b3E,g3W
f1NW,b5E,f5W,d5SW,d1NW,b3SE,c2NE,c6SW,c4E,g4W
f1NW,a6E,e6SW,e1NW,a5E,b5SE,e2NW,d3NE,d6NE,d7W
f1NW,a6E,e6SW,e1NW,a5E,f5SW,f2NW,a7E,c7E,d7SW
f1NW,a6E,e6SW,e1NW,a5E,f5W,e5SW,e2NE,e4SW,e3W
f1NW,a6E,e6SW,e1NW,a5E,f5W,b5E,e5W,c5E,d5SE
f1NW,a6SE,e2NE,e6SW,e4E,f4NE,f5SE,g4SW,g2SW,g1NW

Opening Heatmap

Colour shows the success ratio of this play over the first 10moves; black < red < yellow < white.

Size shows the frequency this move is played.

Unique Positions Reachable at Depth

0123456
1180248428152293973292184126941031

Note: most games do not take board rotation and reflection into consideration.
Multi-part turns could be treated as the same or different depth depending on the implementation.
Counts to depth N include all moves reachable at lower depths.
Inaccuracies may also exist due to hash collisions, but Ai Ai uses 64-bit hashes so these will be a very small fraction of a percentage point.

Shortest Game(s)


672 solutions found at depth 3.

Puzzles

PuzzleSolution

White to win in 23 moves

White to win in 25 moves

White to win in 21 moves

White to win in 26 moves

White to win in 21 moves

White to win in 21 moves

White to win in 19 moves

White to win in 18 moves

White to win in 17 moves

Black to win in 19 moves

White to win in 23 moves

White to win in 18 moves

Selection criteria: first move must be unique, and not forced to avoid losing. Beyond that, Puzzles will be rated by the product of [total move]/[best moves] at each step, and the best puzzles selected.