Bagel is a quick, tense game with random setup for two players in which players try to create as many 3-in-a-rows as possible similar to Tic-Tac-Toe. Each turn, players must decide whether to score points,set up scoring opportunities, or hinder their opponent. Although players will develop general strategiesfor optimizing their scores, the random set up of the board requires players to closely examine eachgame state before placing discs.
Generated at 21/07/2021, 18:59 from 1000 logged games.
Rules
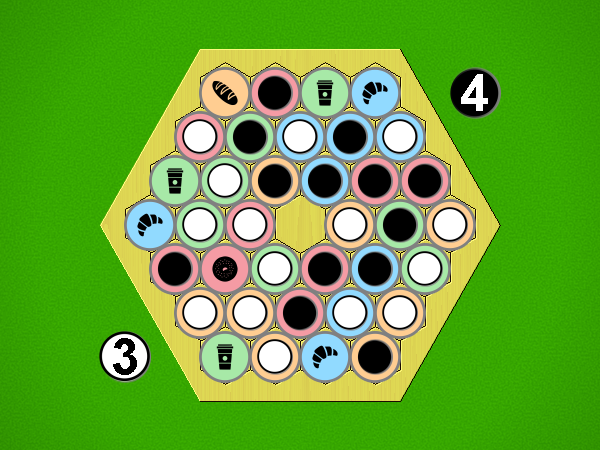
Representative game (in the sense of being of mean length). Wherever you see the 'representative game' referred to in later sections, this is it!
Game Term
An n-in-a-row consists of 1 or more (n) like-colored discs that are aligned and connected. The center space, empty tiles, and opponent discs break connectivity.
Game Play
The first player starts the game by placing a white disc on any empty tile. The pie rule can be applied; see Pie Rule below.
Following the first player's placement, player turns will alternate
.
On a turn, a player must place either one or two discs from his or her reserve. Using the following restrictions:
Discs may only be placed on empty tiles. (This excludes the center space and occupied tiles.)
When two stones are placed, they must be placed on two like-colored (or like-symbolled) tileswhich are aligned (in the same row or diagonal). The intervening tiles can be empty or contain adisc of either player color. The center hole can also be ignored. That is, tiles on opposite sides ofthe center hole can be selected.>/li>
To end a turn, the player should update his or her score using paper and pencil or scoring dice by addingone for each new 3-in-a-row created on the current turn rows that contain at least one of the newlyplaced discs. For example, extending a pre-existing 3-in-a-row to a 4-in-a-row only adds one to theplayers score. See the Scoring section below.
Pie Rule
To apply the pie rule, on the second player's first turn only, he may opt to accept the firstplayer's move as his own. The second player exchanges discs with his opponent and does not place anydiscs. In effect, the second player becomes the new first player! Following this role exchange playcontinues with no further role swapping.
Game End
The game ends when one player cannot place a disc, either due to no remaining empty tiles on theboard or no remaining discs in reserve. At games end scoring verification takes place.
Scoring
Players count the number of 3-in-a-rows created by their discs. The 3-in-a-rows can overlap or intersect.For example, a 5-in-a-row counts as three overlapping 3-in-a-rows. The 3-in-a-rows are counted in allthree directions established by the hex layout. In general, an n-in-a-row scores n-2 points.
Ai Ai calculates the size of the implementation, and compares it to the Ai Ai implementation of the simplest possible game (which just fills the board). Note that this estimate may include some graphics and heuristics code as well as the game logic. See the wikipedia entry for more details.
Playout Complexity Estimate
Playouts per second
45295.60 (22.08µs/playout)
Reference Size
297530.41 (3.36µs/playout)
Ratio (low is good)
6.57
Tavener complexity: the heat generated by playing every possible instance of a game with a perfectly efficient programme. Since this is not possible to calculate, Ai Ai calculates the number of random playouts per second and compares it to the fastest non-trivial Ai Ai game (Connect 4). This ratio gives a practical indication of how complex the game is. Combine this with the computational state space, and you can get an idea of how strong the default (MCTS-based) AI will be.
Playout/Search Speed
Label
Its/s
SD
Nodes/s
SD
Game length
SD
Random playout
3,947
151
167,081
6,426
42
2
search.UCT
121,614
7,826
38
1
Random: 10 second warmup for the hotspot compiler. 100 trials of 1000ms each.
Other: 100 playouts, means calculated over the first 5 moves only to avoid distortion due to speedup at end of game.
Mirroring Strategies
Rotation (Half turn) lost each game as expected.
Reflection (X axis) lost each game as expected.
Reflection (Y axis) lost each game as expected.
Copy last move lost each game as expected.
Mirroring strategies attempt to copy the previous move. On first move, they will attempt to play in the centre. If neither of these are possible, they will pick a random move. Each entry represents a different form of copying; direct copy, reflection in either the X or Y axis, half-turn rotation.
Win % By Player (Bias)
1: White win %
85.80±2.30
Includes draws = 50%
2: Black win %
14.20±2.03
Includes draws = 50%
Draw %
14.80
Percentage of games where all players draw.
Decisive %
85.20
Percentage of games with a single winner.
Samples
1000
Quantity of logged games played
Note: that win/loss statistics may vary depending on thinking time (horizon effect, etc.), bad heuristics, bugs, and other factors, so should be taken with a pinch of salt. (Given perfect play, any game of pure skill will always end in the same result.)
Note: Ai Ai differentiates between states where all players draw or win or lose; this is mostly to support cooperative games.
UCT Skill Chains
Match
AI
Strong Wins
Draws
Strong Losses
#Games
Strong Score
p1 Win%
Draw%
p2 Win%
Game Length
0
Random
1
UCT (its=2)
596
70
251
917
0.6574 <= 0.6881 <= 0.7173
53.65
7.63
38.71
41.83
4
UCT (its=5)
584
94
310
988
0.6082 <= 0.6387 <= 0.6680
54.35
9.51
36.13
40.92
10
UCT (its=11)
592
78
296
966
0.6226 <= 0.6532 <= 0.6826
56.00
8.07
35.92
40.06
18
UCT (its=19)
585
91
317
993
0.6045 <= 0.6349 <= 0.6643
53.07
9.16
37.76
39.35
29
UCT (its=30)
578
105
284
967
0.6214 <= 0.6520 <= 0.6814
52.22
10.86
36.92
38.73
36
UCT (its=98)
610
41
67
718
0.8522 <= 0.8781 <= 0.9001
51.95
5.71
42.34
38.31
37
UCT (its=266)
599
63
94
756
0.8058 <= 0.8340 <= 0.8588
42.46
8.33
49.21
37.70
38
UCT (its=723)
587
87
185
859
0.7034 <= 0.7340 <= 0.7625
24.56
10.13
65.31
37.76
39
UCT (its=1966)
553
155
278
986
0.6090 <= 0.6395 <= 0.6688
10.95
15.72
73.33
37.61
40
UCT (its=5343)
541
179
203
923
0.6524 <= 0.6831 <= 0.7123
15.28
19.39
65.33
37.66
41
UCT (its=14523)
450
361
123
934
0.6444 <= 0.6751 <= 0.7043
18.95
38.65
42.40
37.78
42
UCT (its=39479)
143
224
68
435
0.5394 <= 0.5862 <= 0.6315
18.16
51.49
30.34
37.83
43
UCT (its=39479)
205
590
205
1000
0.4691 <= 0.5000 <= 0.5309
15.50
59.00
25.50
37.80
Search for levels ended: time limit reached.
Level of Play: Strong beats Weak 60% of the time (lower bound with 95% confidence).
Draw%, p1 win% and game length may give some indication of trends as AI strength increases.
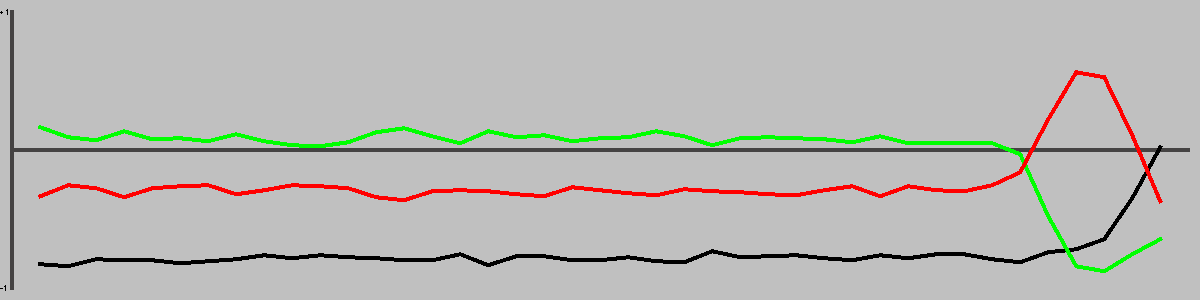
1st Player Win Ratios by Playing Strength
This chart shows the win(green)/draw(black)/loss(red) percentages, as UCT play strength increases. Note that for most games, the top playing strength show here will be distinctly below human standard.
Complexity
Game length
38.32
Branching factor
11.13
Complexity
10^31.69
Based on game length and branching factor
Computational Complexity
10^6.19
Sample quality (100 best): 8.61
Samples
1000
Quantity of logged games played
Computational complexity (where present) is an estimate of the game tree reachable through actual play. For each game in turn, Ai Ai marks the positions reached in a hashtable, then counts the number of new moves added to the table. Once all moves are applied, it treats this sequence as a geometric progression and calculates the sum as n-> infinity.
Move Classification
Distinct actions
38
Number of distinct moves (e.g. "e4") regardless of position in game tree
Good moves
13
A good move is selected by the AI more than the average
Bad moves
25
A bad move is selected by the AI less than the average
Response distance
2.86
Mean distance between move and response; a low value relative to the board size may mean a game is tactical rather than strategic.
Samples
1000
Quantity of logged games played
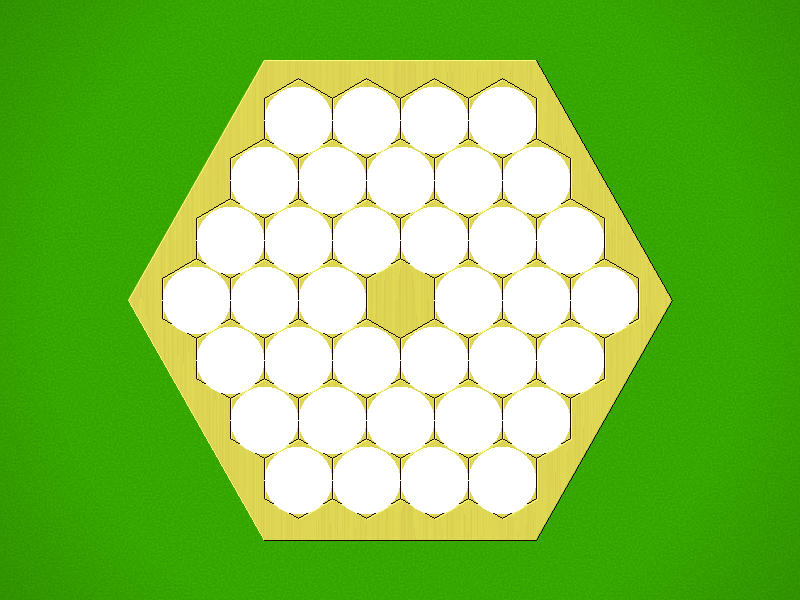
Board Coverage
A mean of 97.30% of board locations were used per game.
Colour and size show the frequency of visits.
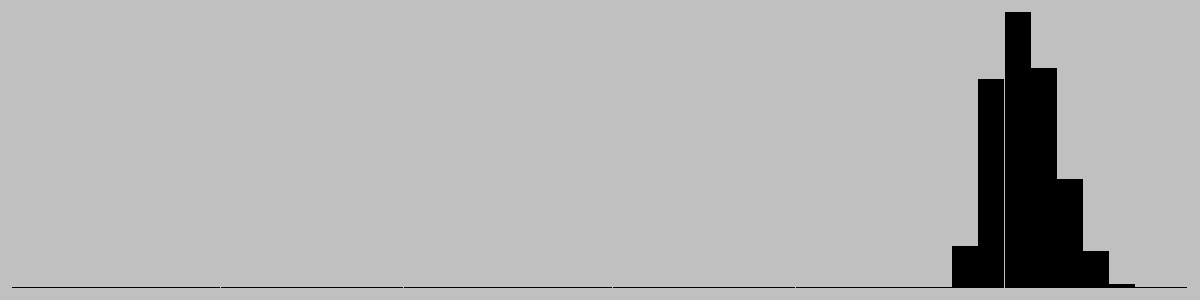
Game Length
Game length frequencies.
Mean
38.32
Mode
[38]
Median
38.0
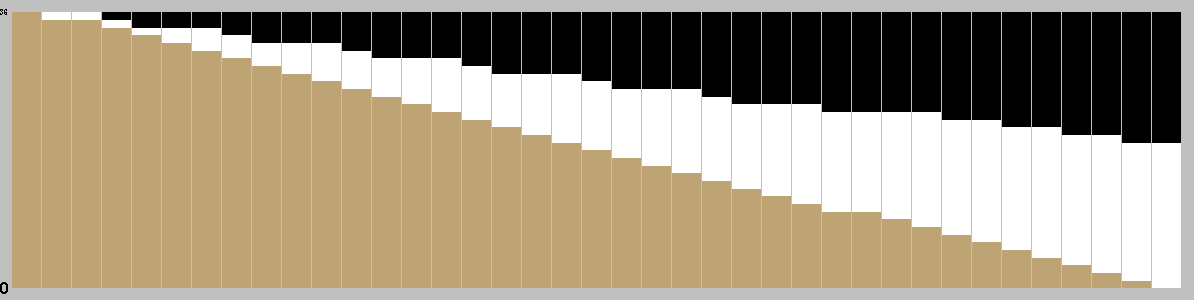
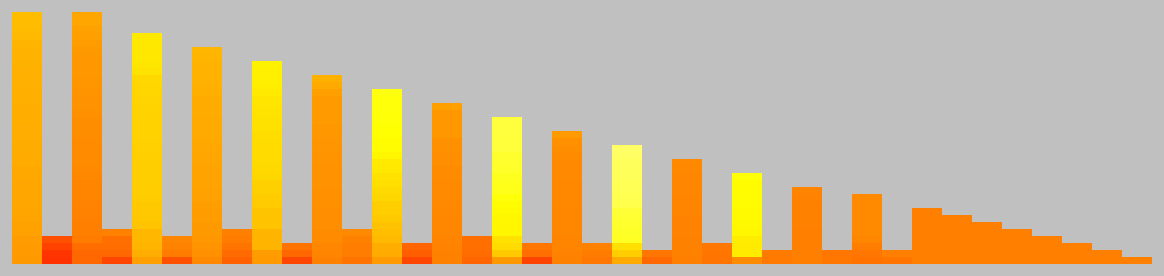
Change in Material Per Turn
This chart is based on a single representative* playout, and gives a feel for the change in material over the course of a game. (* Representative in the sense that it is close to the mean length.)
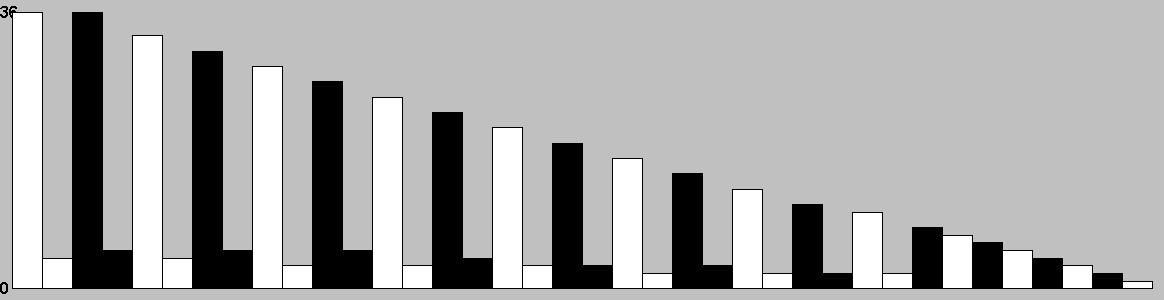
Actions/turn
Table: branching factor per turn, based on a single representative* game. (* Representative in the sense that it is close to the mean game length.)
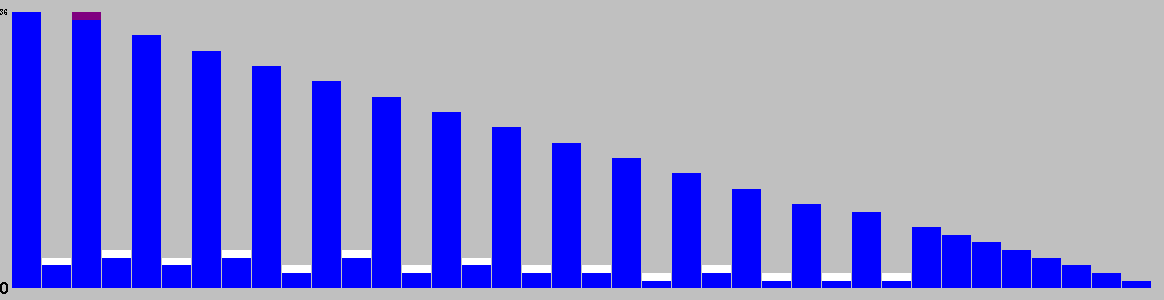
Action Types per Turn
This chart is based on a single representative* game, and gives a feel for the types of moves available throughout that game. (* Representative in the sense that it is close to the mean game length.)
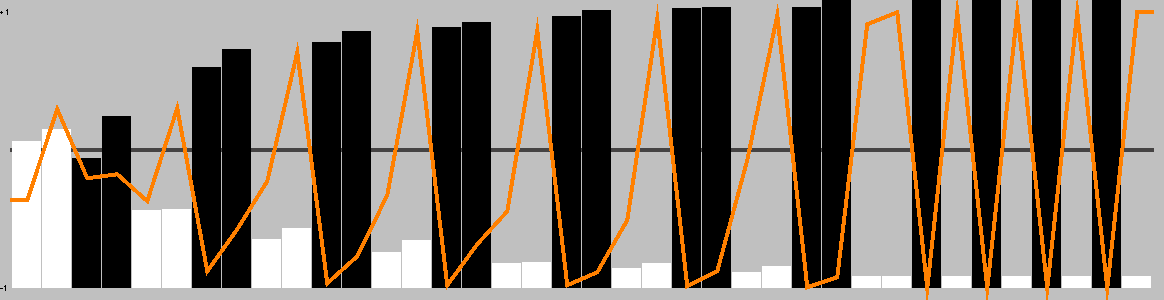
This chart shows the best move value with respect to the active player; the orange line represents the value of doing nothing (null move).
The lead changed on 5% of the game turns. Ai Ai found 0 critical turns (turns with only one good option).
Position Heatmap
This chart shows the relative temperature of all moves each turn. Colour range: black (worst), red, orange(even), yellow, white(best).
Good/Effective moves
Measure
All players
Player 1
Player 2
Mean % of effective moves
66.62
52.18
82.67
Mean no. of effective moves
5.84
4.15
7.72
Effective game space
10^21.14
10^7.74
10^13.40
Mean % of good moves
47.45
89.31
0.93
Mean no. of good moves
5.13
9.45
0.33
Good move game space
10^15.68
10^14.90
10^0.78
These figures were calculated over a single game.
An effective move is one with score 0.1 of the best move (including the best move). -1 (loss) <= score <= 1 (win)
A good move has a score > 0. Note that when there are no good moves, an multiplier of 1 is used for the game space calculation.
Quality Measures
Measure
Value
Description
Hot turns
50.00%
A hot turn is one where making a move is better than doing nothing.
Momentum
15.79%
% of turns where a player improved their score.
Correction
15.79%
% of turns where the score headed back towards equality.
Depth
3.28%
Difference in evaluation between a short and long search.
Drama
0.17%
How much the winner was behind before their final victory.
Foulup Factor
34.21%
Moves that looked better than the best move after a short search.
Surprising turns
0.00%
Turns that looked bad after a short search, but good after a long one.
Last lead change
10.53%
Distance through game when the lead changed for the last time.
Decisiveness
28.95%
Distance from the result being known to the end of the game.
These figures were calculated over a single representative* game, and based on the measures of quality described in "Automatic Generation and Evaluation of Recombination Games" (Cameron Browne, 2007). (* Representative, in the sense that it is close to the mean game length.)
Unique Positions Reachable at Depth
0
1
2
3
4
5
6
7
8
1
36
84
2032
6036
92270
299971
2097687
7222497
Note: most games do not take board rotation and reflection into consideration. Multi-part turns could be treated as the same or different depth depending on the implementation. Counts to depth N include all moves reachable at lower depths. Inaccuracies may also exist due to hash collisions, but Ai Ai uses 64-bit hashes so these will be a very small fraction of a percentage point.
Shortest Game(s)
No solutions found to depth 8.
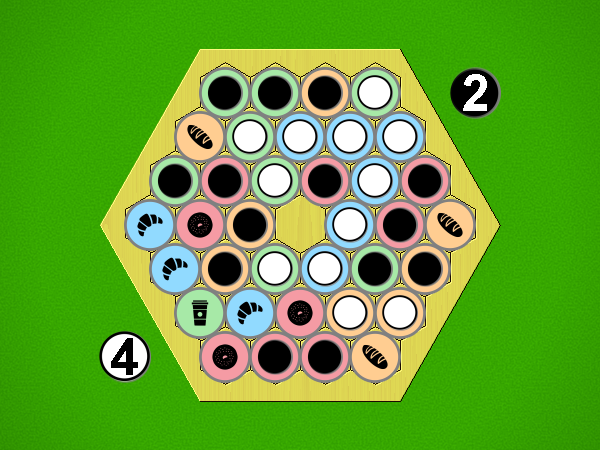
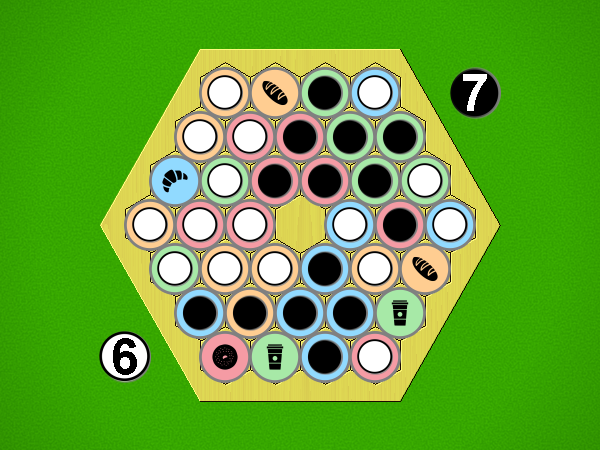
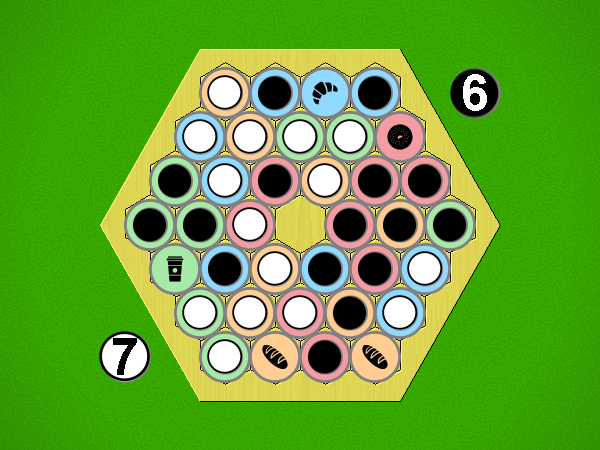
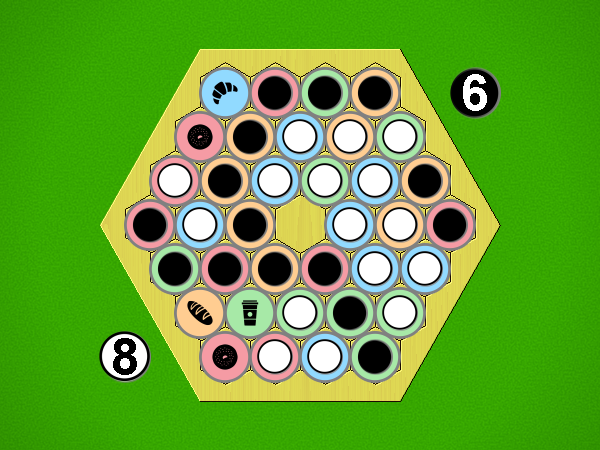
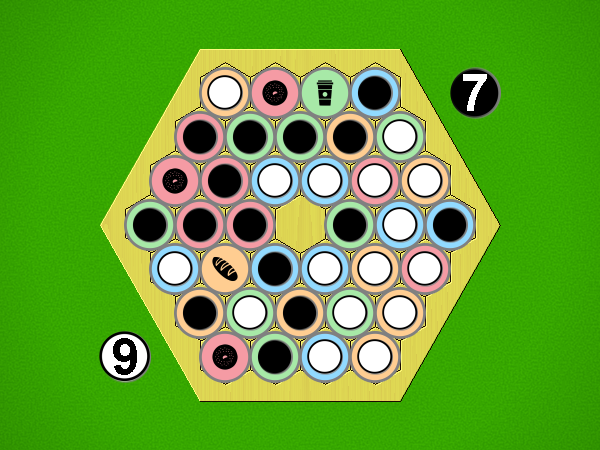
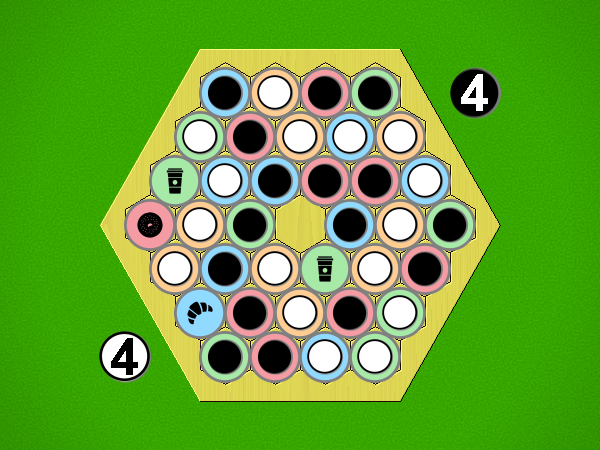
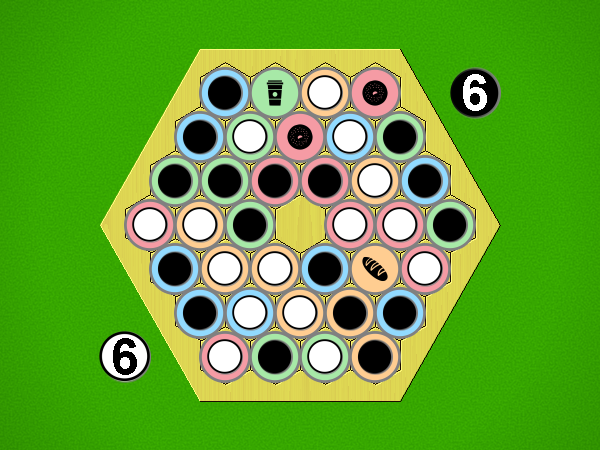
Puzzles
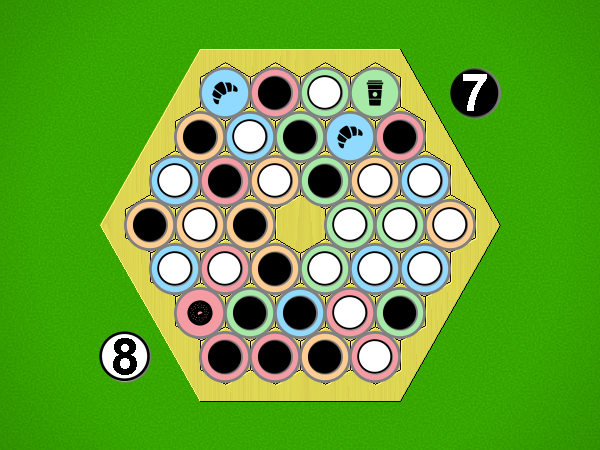
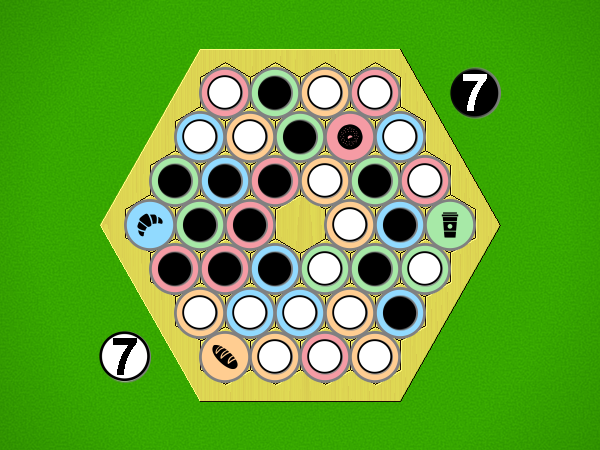
Puzzle
Solution
White to win in 12 moves
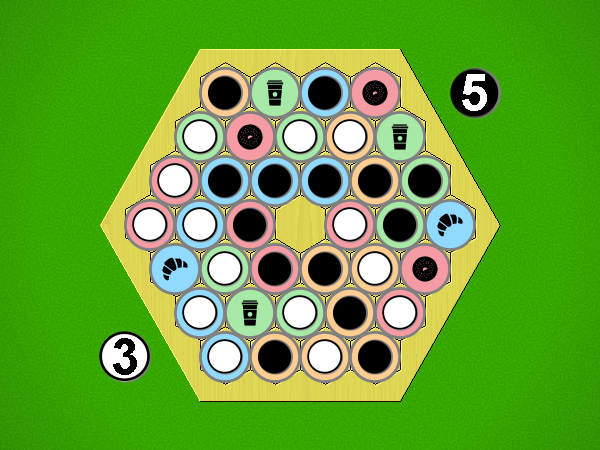
Black to win in 8 moves
White to win in 8 moves
White to win in 6 moves
White to win in 6 moves
Black to win in 6 moves
White to win in 5 moves
White to win in 5 moves
Black to win in 4 moves
Black to win in 4 moves
White to win in 4 moves
White to win in 4 moves
Weak puzzle selection criteria are in place; the first move may not be unique.