Full Report for China Tangle by Christian Freeling
Full Report for China Tangle by Christian Freeling
China Tangle is a game using 63 of the 64 hexagonal tiles of a two-groups transcendental solution of the China Labyrinth as a board.
Generated at 2023-06-16, 04:39 from 1000 logged games.
Rules
Representative game (in the sense of being of mean length). Wherever you see the 'representative game' referred to in later sections, this is it!
Definitions
The China Labyrinth has hexagons with every possible number and pattern of exits, in all possible rotations and reflections, without identical doubles.
A group consists of one or more like coloured checkers that are connected via unbroken paths of like coloured checkers. A group is maximal, meaning that part of a group is not a group.
Rules
The game starts on an empty board, White plays first, Black is entitled to a swap.
If a player on his turn puts one checker on a vacant cell, then all vacant cells that are open to further placements in the same turn are highlighted. These are cells with the same pattern of exits as the cell of the first checker that is placed, including all possible rotations and reflections.
The maximum number of checkers a player may place, if possible, equals 7 minus the number of exits of the cell on which the first checker is placed.
Obviously only one checker can be placed on the one cell with six exits. But place the first checker on a cell with one exit, then you can place six checkers, provided all six cells with one exit are vacant. It will not always be possible to place checkers up to the theoretical limit.
Goal
The game ends when the board is full, or earlier if a player resigns. On a full board the players' groups are compared, and the player with the largest group is the winner. If the players' largest groups are of equal size, then these two groups are out of competition and the next largest groups are compared (which may be the same size for one or both colours), and so on. Because the playing area has an odd number of cells the count is cascading down to an inevitable decision.
Ai Ai calculates the size of the implementation, and compares it to the Ai Ai implementation of the simplest possible game (which just fills the board). Note that this estimate may include some graphics and heuristics code as well as the game logic. See the wikipedia entry for more details.
Playout Complexity Estimate
Playouts per second
20392.22 (49.04µs/playout)
Reference Size
1911680.37 (0.52µs/playout)
Ratio (low is good)
93.75
Tavener complexity: the heat generated by playing every possible instance of a game with a perfectly efficient programme. Since this is not possible to calculate, Ai Ai calculates the number of random playouts per second and compares it to the fastest non-trivial Ai Ai game (Connect 4). This ratio gives a practical indication of how complex the game is. Combine this with the computational state space, and you can get an idea of how strong the default (MCTS-based) AI will be.
State Space Complexity
% new positions/bucket
Samples
811
Confidence
0.00
0: totally unreliable, 100: perfect
State space complexity (where present) is an estimate of the number of distinct game tree reachable through actual play. Over a series of random games, Ai Ai checks each position to see if it is new, or a repeat of a previous position and keeps a total for each game. As the number of games increase, the quantity of new positions seen per game decreases. These games are then partitioned into a number of buckets, and if certain conditions are met, Ai Ai treats the number in each bucket as the start of a strictly decreasing geometric sequence and sums it to estimate the total state space. The accuracy is calculated as 1-[end bucket count]/[starting bucklet count]
Playout/Search Speed
Label
Its/s
SD
Nodes/s
SD
Game length
SD
Random playout
3
2
217
141
76
3
search.UCT
52,409
8,878
70
2
Random: 10 second warmup for the hotspot compiler. 100 trials of 1000ms each.
Other: 100 playouts, means calculated over the first 5 moves only to avoid distortion due to speedup at end of game.
Mirroring Strategies
Rotation (Half turn) lost each game as expected.
Reflection (X axis) lost each game as expected.
Reflection (Y axis) lost each game as expected.
Copy last move lost each game as expected.
Mirroring strategies attempt to copy the previous move. On first move, they will attempt to play in the centre. If neither of these are possible, they will pick a random move. Each entry represents a different form of copying; direct copy, reflection in either the X or Y axis, half-turn rotation.
Win % By Player (Bias)
1: Player 1 (White) win %
39.50±2.98
Includes draws = 50%
2: Player 2 (Black) win %
60.50±3.06
Includes draws = 50%
Draw %
0.00
Percentage of games where all players draw.
Decisive %
100.00
Percentage of games with a single winner.
Samples
1000
Quantity of logged games played
Note: that win/loss statistics may vary depending on thinking time (horizon effect, etc.), bad heuristics, bugs, and other factors, so should be taken with a pinch of salt. (Given perfect play, any game of pure skill will always end in the same result.)
Note: Ai Ai differentiates between states where all players draw or win or lose; this is mostly to support cooperative games.
UCT Skill Chains
Match
AI
Strong Wins
Draws
Strong Losses
#Games
Strong Score
p1 Win%
Draw%
p2 Win%
Game Length
0
Random
1
UCT (its=2)
631
0
330
961
0.6260 <= 0.6566 <= 0.6860
53.90
0.00
46.10
75.32
5
UCT (its=6)
631
0
315
946
0.6364 <= 0.6670 <= 0.6963
53.49
0.00
46.51
74.48
12
UCT (its=13)
631
0
355
986
0.6095 <= 0.6400 <= 0.6693
52.94
0.00
47.06
73.56
14
UCT (its=15)
541
0
459
1000
0.5100 <= 0.5410 <= 0.5717
49.90
0.00
50.10
73.15
15
UCT (its=15)
531
0
469
1000
0.5000 <= 0.5310 <= 0.5618
56.50
0.00
43.50
73.07
Search for levels ended: time limit reached.
Level of Play: Strong beats Weak 60% of the time (lower bound with 95% confidence).
Draw%, p1 win% and game length may give some indication of trends as AI strength increases.
1st Player Win Ratios by Playing Strength
This chart shows the win(green)/draw(black)/loss(red) percentages, as UCT play strength increases. Note that for most games, the top playing strength show here will be distinctly below human standard.
Complexity
Game length
70.06
Branching factor
13.88
Complexity
10^60.31
Based on game length and branching factor
Computational Complexity
10^7.09
Sample quality (100 best): 7.69
Samples
1000
Quantity of logged games played
Computational complexity (where present) is an estimate of the game tree reachable through actual play. For each game in turn, Ai Ai marks the positions reached in a hashtable, then counts the number of new moves added to the table. Once all moves are applied, it treats this sequence as a geometric progression and calculates the sum as n-> infinity.
Move Classification
Board Size
331
Quantity of distinct board cells
Distinct actions
449
Quantity of distinct moves (e.g. "e4") regardless of position in game tree
Killer moves
1
A 'killer' move is selected by the AI more than 50% of the time Killers: q24
Good moves
83
A good move is selected by the AI more than the average
Bad moves
366
A bad move is selected by the AI less than the average
Terrible moves
1
A terrible move is never selected by the AI Terrible moves: v22
Response distance%
19.92%
Distance from move to response / maximum board distance; a low value suggests a game is tactical rather than strategic.
Samples
1000
Quantity of logged games played
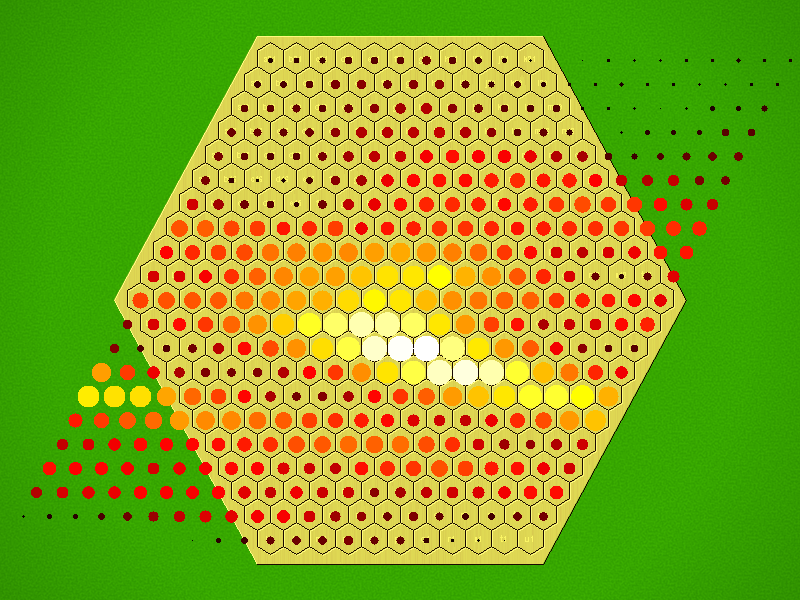
Board Coverage
A mean of 18.83% of board locations were used per game.
Colour and size show the frequency of visits.
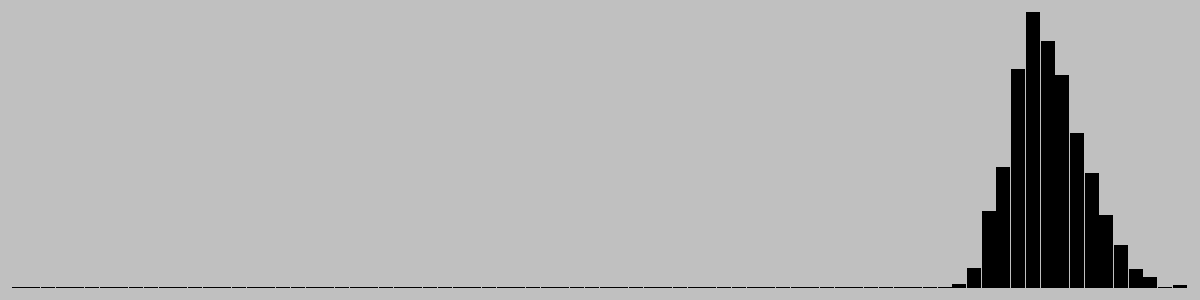
Game Length
Game length frequencies.
Mean
70.06
Mode
[69]
Median
70.0
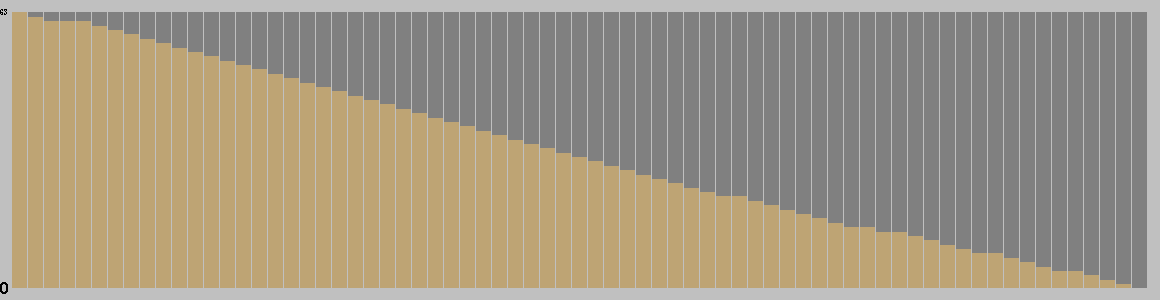
Change in Material Per Turn
Mean change in material/round
2.25
Complete round of play (all players)
This chart is based on a single representative* playout, and gives a feel for the change in material over the course of a game. (* Representative in the sense that it is close to the mean length.)
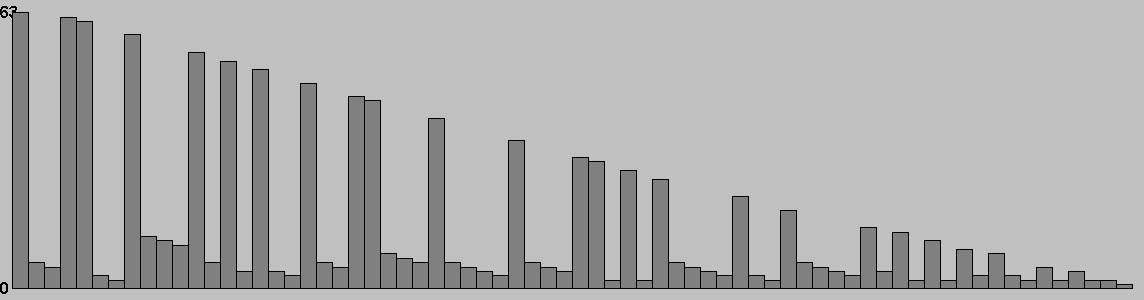
Actions/turn
Table: branching factor per turn, based on a single representative* game. (* Representative in the sense that it is close to the mean game length.)
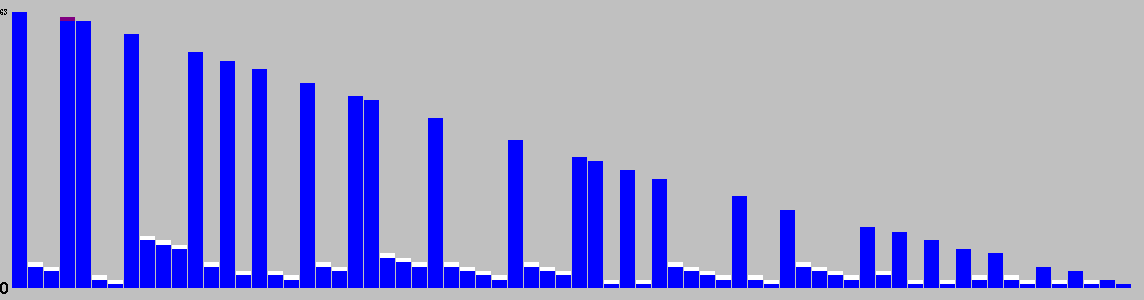
Action Types per Turn
This chart is based on a single representative* game, and gives a feel for the types of moves available throughout that game. (* Representative in the sense that it is close to the mean game length.)
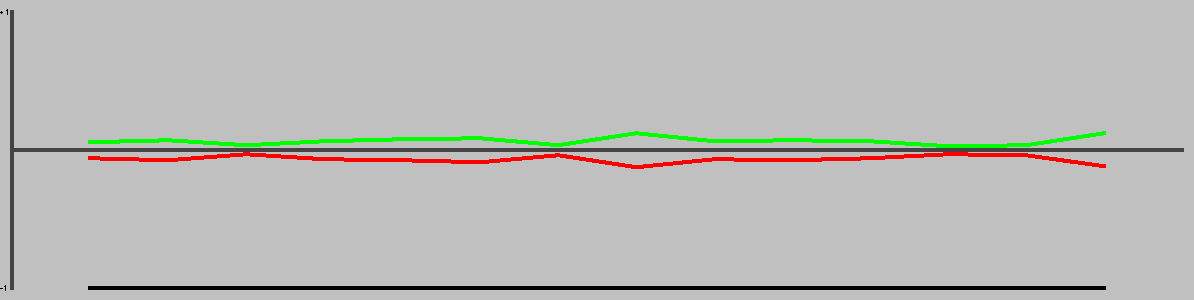
This chart shows the best move value with respect to the active player; the orange line represents the value of doing nothing (null move).
The lead changed on 8% of the game turns. Ai Ai found 8 critical turns (turns with only one good option).
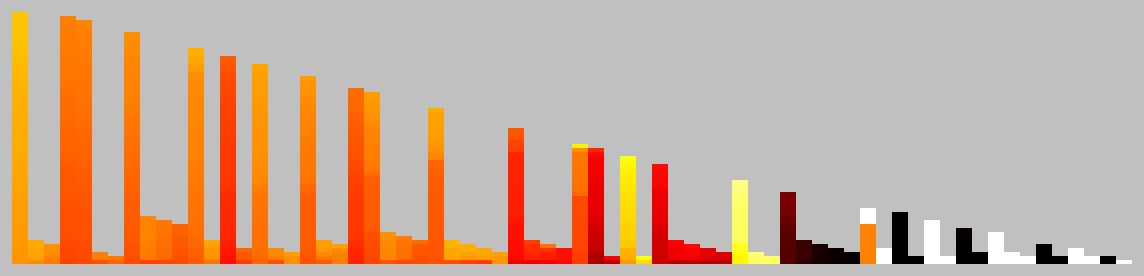
Position Heatmap
This chart shows the relative temperature of all moves each turn. Colour range: black (worst), red, orange(even), yellow, white(best).
Good/Effective moves
Measure
All players
Player 1
Player 2
Mean % of effective moves
59.31
46.51
70.72
Mean no. of effective moves
5.26
4.09
6.30
Effective game space
10^37.38
10^12.76
10^24.61
Mean % of good moves
32.61
62.69
5.79
Mean no. of good moves
3.23
5.85
0.89
Good move game space
10^20.80
10^16.72
10^4.08
These figures were calculated over a single game.
An effective move is one with score 0.1 of the best move (including the best move). -1 (loss) <= score <= 1 (win)
A good move has a score > 0. Note that when there are no good moves, an multiplier of 1 is used for the game space calculation.
Quality Measures
Measure
Value
Description
Hot turns
51.43%
A hot turn is one where making a move is better than doing nothing.
Momentum
18.57%
% of turns where a player improved their score.
Correction
27.14%
% of turns where the score headed back towards equality.
Depth
4.40%
Difference in evaluation between a short and long search.
Drama
0.04%
How much the winner was behind before their final victory.
Foulup Factor
47.14%
Moves that looked better than the best move after a short search.
Surprising turns
2.86%
Turns that looked bad after a short search, but good after a long one.
Last lead change
31.43%
Distance through game when the lead changed for the last time.
Decisiveness
14.29%
Distance from the result being known to the end of the game.
These figures were calculated over a single representative* game, and based on the measures of quality described in "Automatic Generation and Evaluation of Recombination Games" (Cameron Browne, 2007). (* Representative, in the sense that it is close to the mean game length.)
Unique Positions Reachable at Depth
0
1
2
3
4
5
6
7
8
9
1
63
304
1878
11083
79172
415948
2263169
10887897
42380410
Note: most games do not take board rotation and reflection into consideration. Multi-part turns could be treated as the same or different depth depending on the implementation. Counts to depth N include all moves reachable at lower depths. Inaccuracies may also exist due to hash collisions, but Ai Ai uses 64-bit hashes so these will be a very small fraction of a percentage point.