Full Report for Chomp by David Gale,Frederik Schuh
Full Report for Chomp by David Gale,Frederik Schuh
Last to move loses.
Generated at 09/02/2022, 22:45 from 1000 logged games.
Rules
Representative game (in the sense of being of mean length). Wherever you see the 'representative game' referred to in later sections, this is it!
Chomp is a two-player strategy game played on a rectangular grid made up of smaller square cells, which can be thought of as the blocks of a chocolate bar. The players take it in turns to choose one block and "eat it" (remove from the board), together with those that are above it and to its right. The bottom left block is "poisoned" and the player who eats this loses.
Interesting as a programming AI experience. otherwise, repetitive and dull..
stenkul
2
Paper and pencil version.
Kaffedrake
2
Another Nim variant.
schwarzspecht
7
Kolomogorov Complexity Analysis
Size (bytes)
24476
Reference Size
10673
Ratio
2.29
Ai Ai calculates the size of the implementation, and compares it to the Ai Ai implementation of the simplest possible game (which just fills the board). Note that this estimate may include some graphics and heuristics code as well as the game logic. See the wikipedia entry for more details.
Playout Complexity Estimate
Playouts per second
1232134.06 (0.81µs/playout)
Reference Size
385311.91 (2.60µs/playout)
Ratio (low is good)
0.31
Tavener complexity: the heat generated by playing every possible instance of a game with a perfectly efficient programme. Since this is not possible to calculate, Ai Ai calculates the number of random playouts per second and compares it to the fastest non-trivial Ai Ai game (Connect 4). This ratio gives a practical indication of how complex the game is. Combine this with the computational state space, and you can get an idea of how strong the default (MCTS-based) AI will be.
State Space Complexity
% new positions/bucket
State Space Complexity
922
State Space Complexity (log 10)
2.96
Samples
2092834
Confidence
100.00
0: totally unreliable, 100: perfect
State space complexity (where present) is an estimate of the number of distinct game tree reachable through actual play. Over a series of random games, Ai Ai checks each position to see if it is new, or a repeat of a previous position and keeps a total for each game. As the number of games increase, the quantity of new positions seen per game decreases. These games are then partitioned into a number of buckets, and if certain conditions are met, Ai Ai treats the number in each bucket as the start of a strictly decreasing geometric sequence and sums it to estimate the total state space. The accuracy is calculated as 1-[end bucket count]/[starting bucklet count]
Playout/Search Speed
Label
Its/s
SD
Nodes/s
SD
Game length
SD
Random playout
4,288,102
34,984
23,988,709
196,192
6
2
search.UCT
2,489,129
691,935
14
1
Random: 10 second warmup for the hotspot compiler. 100 trials of 1000ms each.
Other: 100 playouts, means calculated over the first 5 moves only to avoid distortion due to speedup at end of game.
Mirroring Strategies
Rotation (Half turn) lost each game as expected.
Reflection (X axis) lost each game as expected.
Reflection (Y axis) lost each game as expected.
Copy last move lost each game as expected.
Mirroring strategies attempt to copy the previous move. On first move, they will attempt to play in the centre. If neither of these are possible, they will pick a random move. Each entry represents a different form of copying; direct copy, reflection in either the X or Y axis, half-turn rotation.
Win % By Player (Bias)
1: Player 1 win %
75.20±2.77
Includes draws = 50%
2: Player 2 win %
24.80±2.58
Includes draws = 50%
Draw %
0.00
Percentage of games where all players draw.
Decisive %
100.00
Percentage of games with a single winner.
Samples
1000
Quantity of logged games played
Note: that win/loss statistics may vary depending on thinking time (horizon effect, etc.), bad heuristics, bugs, and other factors, so should be taken with a pinch of salt. (Given perfect play, any game of pure skill will always end in the same result.)
Note: Ai Ai differentiates between states where all players draw or win or lose; this is mostly to support cooperative games.
UCT Skill Chains
Match
AI
Strong Wins
Draws
Strong Losses
#Games
Strong Score
p1 Win%
Draw%
p2 Win%
Game Length
0
Random
1
UCT (its=2)
631
0
232
863
0.7006 <= 0.7312 <= 0.7597
48.55
0.00
51.45
6.12
4
UCT (its=5)
631
0
343
974
0.6173 <= 0.6478 <= 0.6772
51.95
0.00
48.05
6.71
8
UCT (its=9)
631
0
354
985
0.6102 <= 0.6406 <= 0.6700
50.36
0.00
49.64
6.99
20
UCT (its=21)
631
0
366
997
0.6025 <= 0.6329 <= 0.6623
49.15
0.00
50.85
7.03
30
UCT (its=82)
631
0
255
886
0.6815 <= 0.7122 <= 0.7410
50.11
0.00
49.89
8.09
31
UCT (its=222)
631
0
235
866
0.6981 <= 0.7286 <= 0.7572
49.88
0.00
50.12
10.02
32
UCT (its=603)
631
0
327
958
0.6281 <= 0.6587 <= 0.6880
52.61
0.00
47.39
10.76
33
UCT (its=1638)
631
0
245
876
0.6897 <= 0.7203 <= 0.7490
53.08
0.00
46.92
10.92
34
UCT (its=4452)
631
0
278
909
0.6635 <= 0.6942 <= 0.7233
53.03
0.00
46.97
11.66
36
UCT (its=32899)
631
0
281
912
0.6612 <= 0.6919 <= 0.7210
43.75
0.00
56.25
12.18
37
UCT (its=89429)
631
0
327
958
0.6281 <= 0.6587 <= 0.6880
38.20
0.00
61.80
12.54
38
UCT (its=243093)
631
0
273
904
0.6673 <= 0.6980 <= 0.7270
41.04
0.00
58.96
13.20
39
UCT (its=660794)
631
0
282
913
0.6604 <= 0.6911 <= 0.7202
41.18
0.00
58.82
13.54
40
UCT (its=1796224)
231
0
111
342
0.6241 <= 0.6754 <= 0.7229
40.94
0.00
59.06
13.74
41
UCT (its=1796224)
502
0
498
1000
0.4711 <= 0.5020 <= 0.5329
41.00
0.00
59.00
13.92
Search for levels ended: time limit reached.
Level of Play: Strong beats Weak 60% of the time (lower bound with 95% confidence).
Draw%, p1 win% and game length may give some indication of trends as AI strength increases.
1st Player Win Ratios by Playing Strength
This chart shows the win(green)/draw(black)/loss(red) percentages, as UCT play strength increases. Note that for most games, the top playing strength show here will be distinctly below human standard.
Complexity
Game length
7.45
Branching factor
14.05
Complexity
10^6.56
Based on game length and branching factor
Computational Complexity
10^2.95
Saturation reached - accuracy very high.
Samples
1000
Quantity of logged games played
Computational complexity (where present) is an estimate of the game tree reachable through actual play. For each game in turn, Ai Ai marks the positions reached in a hashtable, then counts the number of new moves added to the table. Once all moves are applied, it treats this sequence as a geometric progression and calculates the sum as n-> infinity.
Move Classification
Board Size
30
Quantity of distinct board cells
Distinct actions
30
Quantity of distinct moves (e.g. "e4") regardless of position in game tree
Good moves
12
A good move is selected by the AI more than the average
Bad moves
18
A bad move is selected by the AI less than the average
Samples
1000
Quantity of logged games played
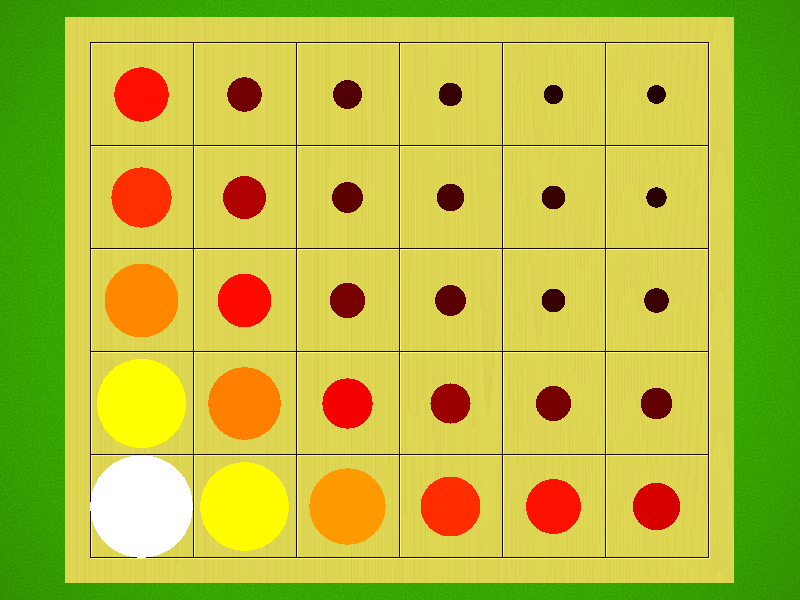
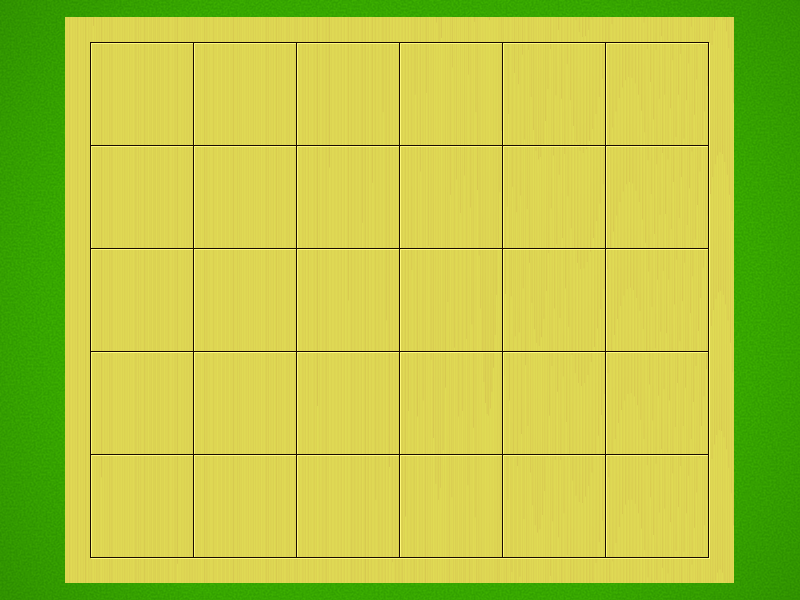
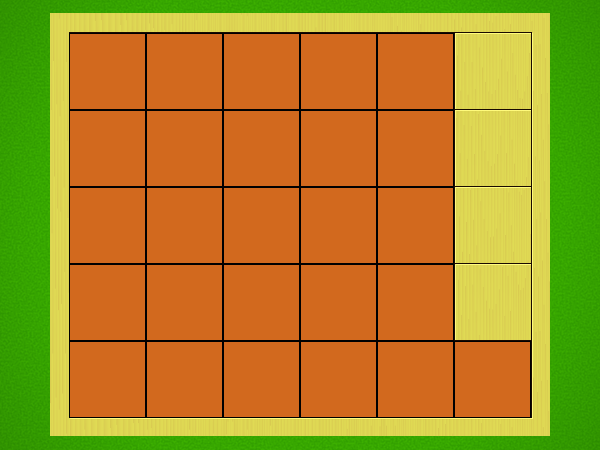
Board Coverage
A mean of 24.82% of board locations were used per game.
Colour and size show the frequency of visits.
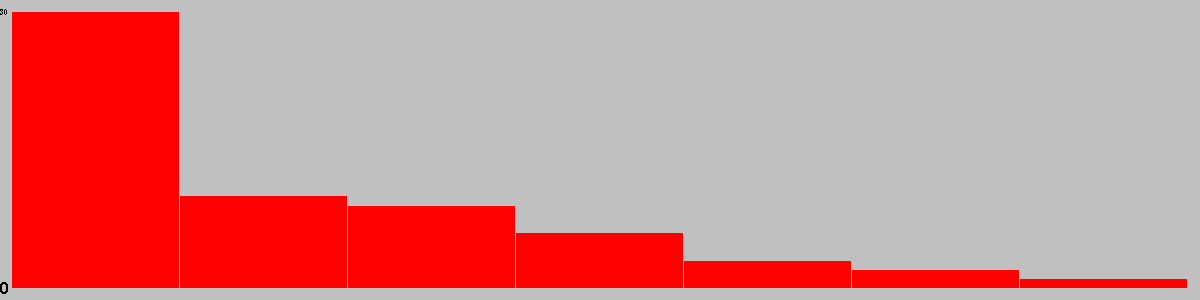
Game Length
Game length frequencies.
Mean
7.45
Mode
[6]
Median
6.0
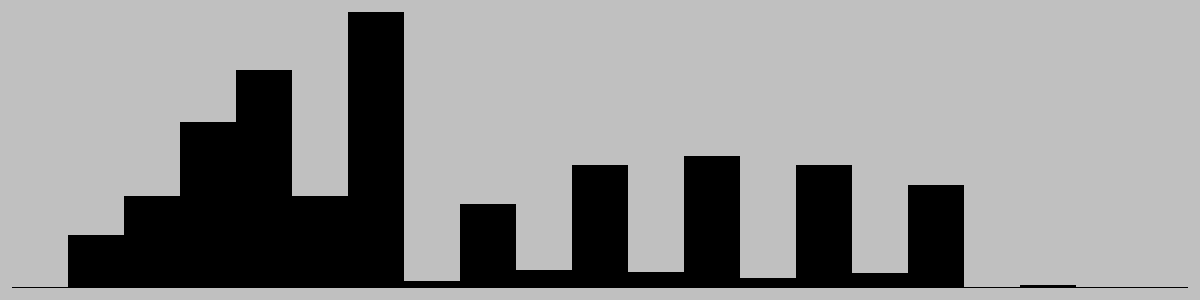
Change in Material Per Turn
Mean change in material/round
0.00
Complete round of play (all players)
This chart is based on a single representative* playout, and gives a feel for the change in material over the course of a game. (* Representative in the sense that it is close to the mean length.)
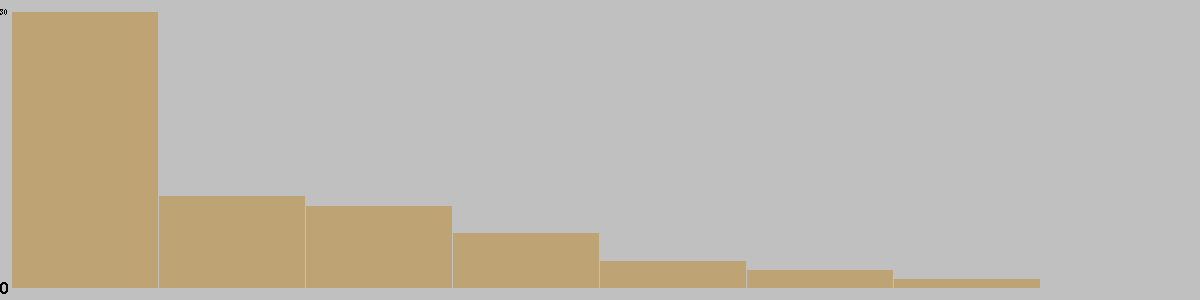
Actions/turn
Table: branching factor per turn, based on a single representative* game. (* Representative in the sense that it is close to the mean game length.)
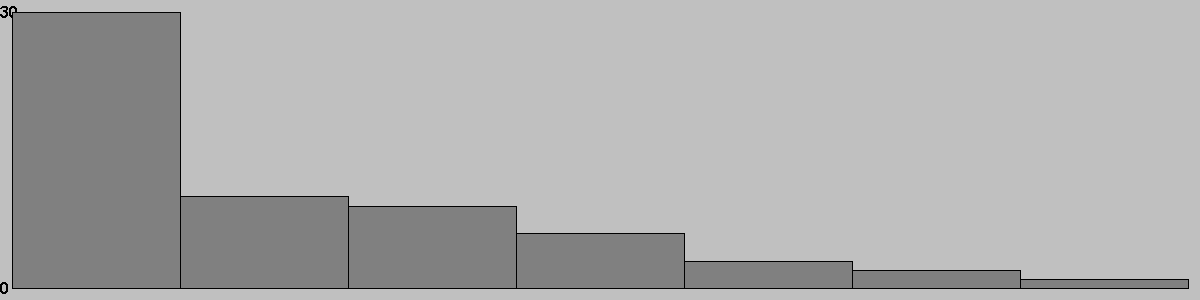
Action Types per Turn
This chart is based on a single representative* game, and gives a feel for the types of moves available throughout that game. (* Representative in the sense that it is close to the mean game length.)
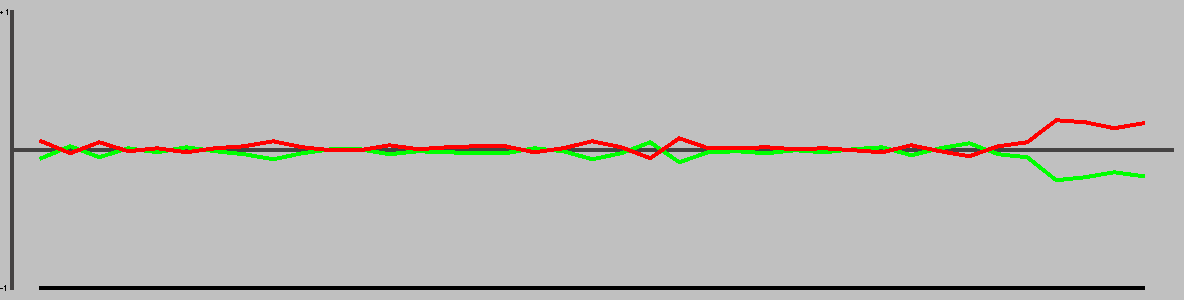
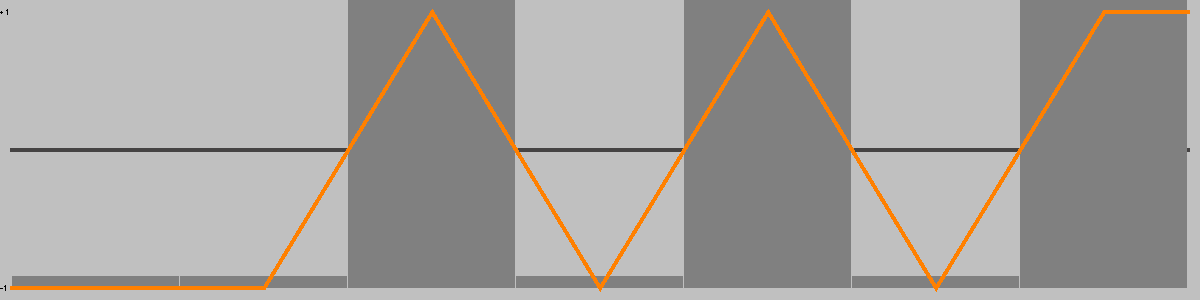
This chart shows the best move value with respect to the active player; the orange line represents the value of doing nothing (null move).
First player's position continued to deteriorate throughout the game. The lead changed on 14% of the game turns. Ai Ai found 4 critical turns (turns with only one good option).
Position Heatmap
This chart shows the relative temperature of all moves each turn. Colour range: black (worst), red, orange(even), yellow, white(best).
Good/Effective moves
Measure
All players
Player 1
Player 2
Mean % of effective moves
54.29
75.83
25.56
Mean no. of effective moves
2.43
3.50
1.00
Effective game space
10^1.43
10^1.43
10^0.00
Mean % of good moves
11.43
0.83
25.56
Mean no. of good moves
0.57
0.25
1.00
Good move game space
10^0.00
10^0.00
10^0.00
These figures were calculated over a single game.
An effective move is one with score 0.1 of the best move (including the best move). -1 (loss) <= score <= 1 (win)
A good move has a score > 0. Note that when there are no good moves, an multiplier of 1 is used for the game space calculation.
Quality Measures
Measure
Value
Description
Hot turns
57.14%
A hot turn is one where making a move is better than doing nothing.
Momentum
0.00%
% of turns where a player improved their score.
Correction
0.00%
% of turns where the score headed back towards equality.
Depth
0.00%
Difference in evaluation between a short and long search.
Drama
0.00%
How much the winner was behind before their final victory.
Foulup Factor
0.00%
Moves that looked better than the best move after a short search.
Surprising turns
0.00%
Turns that looked bad after a short search, but good after a long one.
Last lead change
28.57%
Distance through game when the lead changed for the last time.
Decisiveness
100.00%
Distance from the result being known to the end of the game.
These figures were calculated over a single representative* game, and based on the measures of quality described in "Automatic Generation and Evaluation of Recombination Games" (Cameron Browne, 2007). (* Representative, in the sense that it is close to the mean game length.)
Opening Heatmap
Colour shows the success ratio of this play over the first 10moves; black < red < yellow < white.
Size shows the frequency this move is played.
Puzzles
Puzzle
Solution
Player 1 to win in 12 moves
Selection criteria: first move must be unique, and not forced to avoid losing. Beyond that, Puzzles will be rated by the product of [total move]/[best moves] at each step, and the best puzzles selected.