Rules
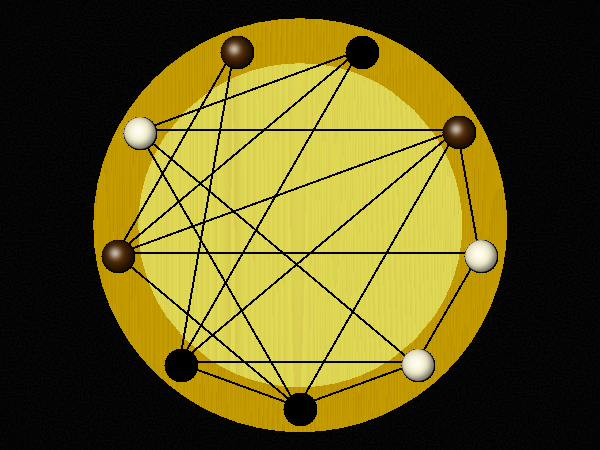
Representative game (in the sense of being of mean length). Wherever you see the 'representative game' referred to in later sections, this is it!
Each time you move a piece, that move can no longer be made. The last one to move, wins.
If you can't move, you lose; each move can be made only once.
Generated at 10/10/2020, 04:25 from 30859 logged games.
Representative game (in the sense of being of mean length). Wherever you see the 'representative game' referred to in later sections, this is it!
Each time you move a piece, that move can no longer be made. The last one to move, wins.
General comments:
| BGG Entry | Claustrophobia |
|---|---|
| BGG Rating | null |
| #Voters | null |
| SD | null |
| BGG Weight | null |
| #Voters | null |
| Year | null |
| Size (bytes) | 22924 |
|---|---|
| Reference Size | 10293 |
| Ratio | 2.23 |
Ai Ai calculates the size of the implementation, and compares it to the Ai Ai implementation of the simplest possible game (which just fills the board). Note that this estimate may include some graphics and heuristics code as well as the game logic. See the wikipedia entry for more details.
| Playouts per second | 63582.49 (15.73µs/playout) |
|---|---|
| Reference Size | 1808645.32 (0.55µs/playout) |
| Ratio (low is good) | 28.45 |
Tavener complexity: the heat generated by playing every possible instance of a game with a perfectly efficient programme. Since this is not possible to calculate, Ai Ai calculates the number of random playouts per second and compares it to the fastest non-trivial Ai Ai game (Connect 4). This ratio gives a practical indication of how complex the game is. Combine this with the computational state space, and you can get an idea of how strong the default (MCTS-based) AI will be.
| Label | Its/s | SD | Nodes/s | SD | Game length | SD |
|---|---|---|---|---|---|---|
| Random playout | 94,297 | 2,522 | 3,068,232 | 82,018 | 33 | 3 |
| search.UCB | 102,229 | 4,881 | 31 | 4 | ||
| search.UCT | 99,800 | 4,388 | 32 | 2 |
Random: 10 second warmup for the hotspot compiler. 100 trials of 1000ms each.
Other: 100 playouts, means calculated over the first 5 moves only to avoid distortion due to speedup at end of game.
Rotation (Half turn) lost each game as expected.
Reflection (X axis) lost each game as expected.
Reflection (Y axis) lost each game as expected.
Copy last move lost each game as expected.
Mirroring strategies attempt to copy the previous move. On first move, they will attempt to play in the centre. If neither of these are possible, they will pick a random move. Each entry represents a different form of copying; direct copy, reflection in either the X or Y axis, half-turn rotation.
| 1: White win % | 46.31±0.56 | Includes draws = 50% |
|---|---|---|
| 2: Black win % | 53.69±0.56 | Includes draws = 50% |
| Draw % | 0.00 | Percentage of games where all players draw. |
| Decisive % | 100.00 | Percentage of games with a single winner. |
| Samples | 30859 | Quantity of logged games played |
Note: that win/loss statistics may vary depending on thinking time (horizon effect, etc.), bad heuristics, bugs, and other factors, so should be taken with a pinch of salt. (Given perfect play, any game of pure skill will always end in the same result.)
Note: Ai Ai differentiates between states where all players draw or win or lose; this is mostly to support cooperative games.
| Match | AI | Strong Wins | Draws | Strong Losses | #Games | Strong Score | p1 Win% | Draw% | p2 Win% | Game Length |
|---|---|---|---|---|---|---|---|---|---|---|
| 0 | Random | |||||||||
| 1 | UCT (its=2) | 631 | 0 | 261 | 892 | 0.6767 <= 0.7074 <= 0.7363 | 46.30 | 0.00 | 53.70 | 32.44 |
| 5 | UCT (its=6) | 631 | 0 | 274 | 905 | 0.6665 <= 0.6972 <= 0.7263 | 47.51 | 0.00 | 52.49 | 31.62 |
| 9 | UCT (its=24) | 631 | 0 | 234 | 865 | 0.6989 <= 0.7295 <= 0.7580 | 46.01 | 0.00 | 53.99 | 31.48 |
| 10 | UCT (its=67) | 631 | 0 | 312 | 943 | 0.6385 <= 0.6691 <= 0.6984 | 47.40 | 0.00 | 52.60 | 31.61 |
| 11 | UCT (its=181) | 631 | 0 | 295 | 926 | 0.6507 <= 0.6814 <= 0.7106 | 47.95 | 0.00 | 52.05 | 31.92 |
| 12 | UCT (its=491) | 631 | 0 | 271 | 902 | 0.6688 <= 0.6996 <= 0.7286 | 49.00 | 0.00 | 51.00 | 32.07 |
| 13 | UCT (its=1336) | 631 | 0 | 250 | 881 | 0.6856 <= 0.7162 <= 0.7450 | 44.49 | 0.00 | 55.51 | 32.21 |
| 14 | UCT (its=3631) | 631 | 0 | 279 | 910 | 0.6627 <= 0.6934 <= 0.7225 | 45.71 | 0.00 | 54.29 | 32.42 |
| 15 | UCT (its=9870) | 631 | 0 | 266 | 897 | 0.6727 <= 0.7035 <= 0.7324 | 45.04 | 0.00 | 54.96 | 32.37 |
| 16 | UCT (its=26829) | 509 | 0 | 229 | 738 | 0.6554 <= 0.6897 <= 0.7220 | 39.02 | 0.00 | 60.98 | 32.52 |
| 17 | UCT (its=26829) | 485 | 0 | 515 | 1000 | 0.4541 <= 0.4850 <= 0.5160 | 37.70 | 0.00 | 62.30 | 32.33 |
Search for levels ended: time limit reached.
Level of Play: Strong beats Weak 60% of the time (lower bound with 95% confidence).
Draw%, p1 win% and game length may give some indication of trends as AI strength increases.
This chart shows the win(green)/draw(black)/loss(red) percentages, as UCT play strength increases. Note that for most games, the top playing strength show here will be distinctly below human standard.
| Game length | 31.86 | |
|---|---|---|
| Branching factor | 5.21 | |
| Complexity | 10^20.43 | Based on game length and branching factor |
| Computational Complexity | 10^7.05 | Sample quality (100 best): 9.82 |
| Samples | 30859 | Quantity of logged games played |
Computational complexity (where present) is an estimate of the game tree reachable through actual play. For each game in turn, Ai Ai marks the positions reached in a hashtable, then counts the number of new moves added to the table. Once all moves are applied, it treats this sequence as a geometric progression and calculates the sum as n-> infinity.
| Distinct actions | 73 | Number of distinct moves (e.g. "e4") regardless of position in game tree |
|---|---|---|
| Good moves | 5 | A good move is selected by the AI more than the average |
| Bad moves | 67 | A bad move is selected by the AI less than the average |
| Response distance | 3.33 | Mean distance between move and response; a low value relative to the board size may mean a game is tactical rather than strategic. |
| Samples | 30859 | Quantity of logged games played |
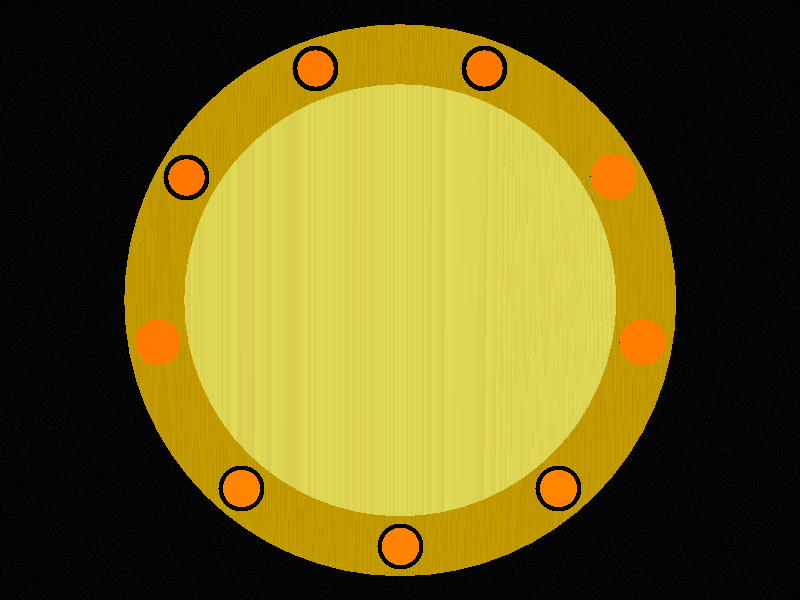
A mean of 99.99% of board locations were used per game.
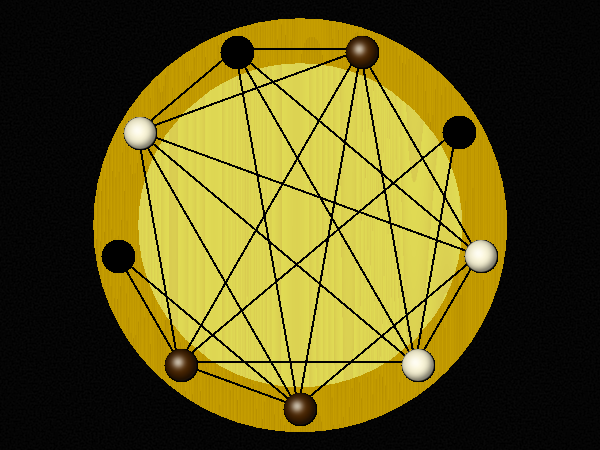
Colour and size show the frequency of visits.
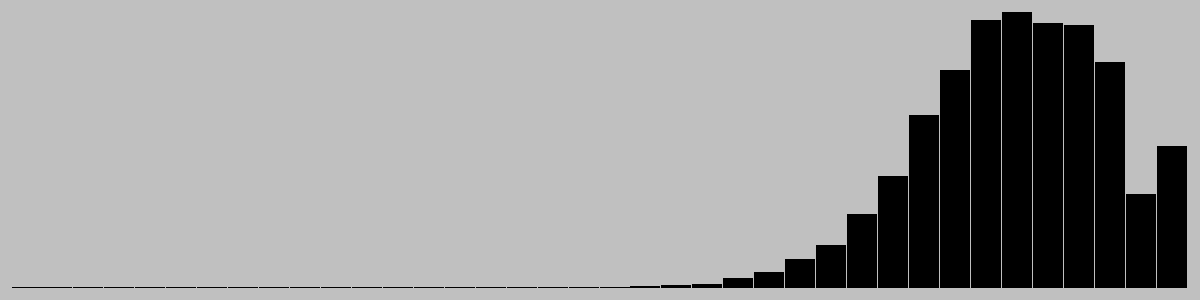
Game length frequencies.
| Mean | 31.86 |
|---|---|
| Mode | [32] |
| Median | 32.0 |

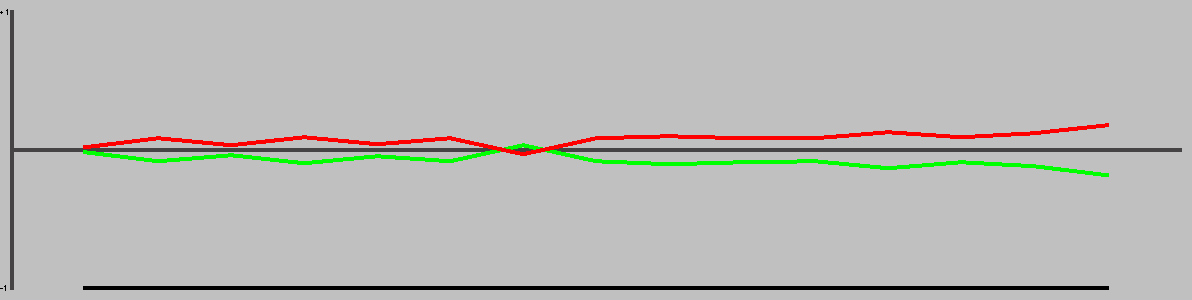
This chart is based on a single representative* playout, and gives a feel for the change in material over the course of a game. (* Representative in the sense that it is close to the mean length.)
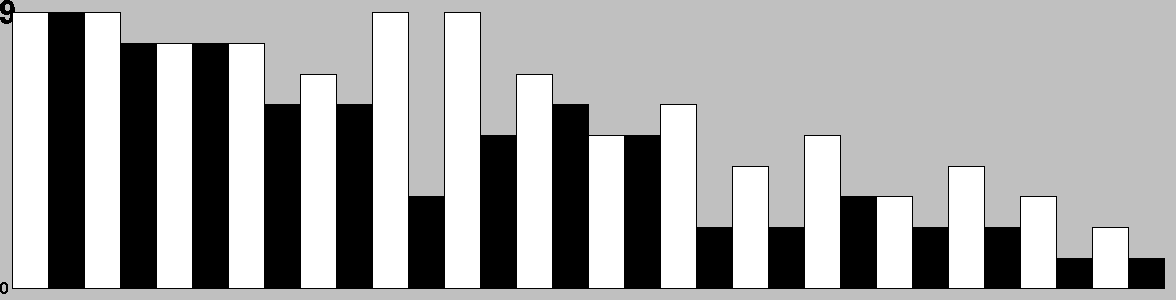
Table: branching factor per turn, based on a single representative* game. (* Representative in the sense that it is close to the mean game length.)
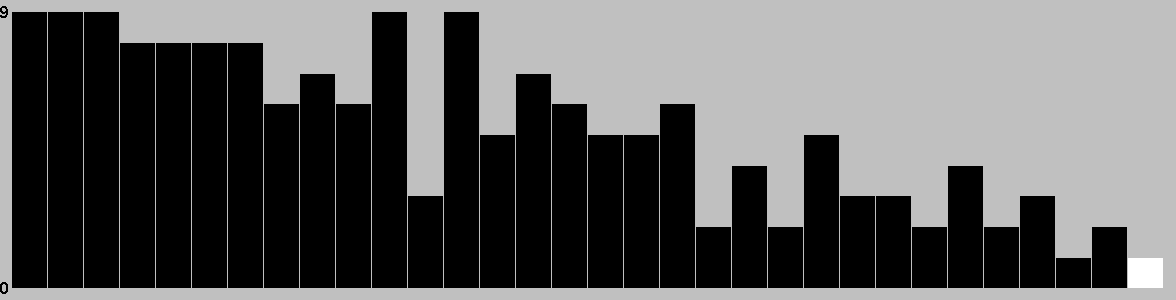
This chart is based on a single representative* game, and gives a feel for the types of moves available throughout that game. (* Representative in the sense that it is close to the mean game length.)
Red: removal, Black: move, Blue: Add, Grey: pass, Purple: swap sides, Brown: other.
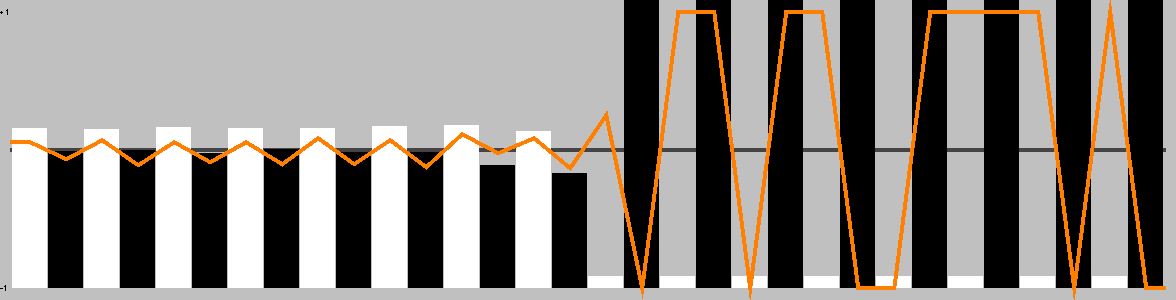
This chart shows the best move value with respect to the active player; the orange line represents the value of doing nothing (null move).
The lead changed on 3% of the game turns. Ai Ai found 4 critical turns (turns with only one good option).
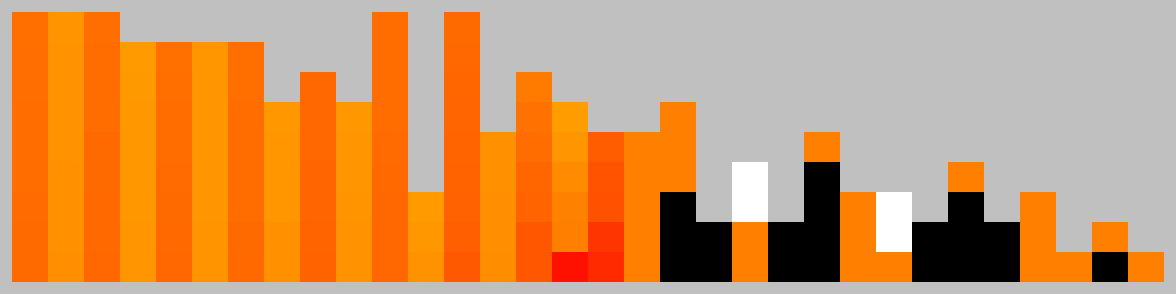
This chart shows the relative temperature of all moves each turn. Colour range: black (worst), red, orange(even), yellow, white(best).
| Measure | All players | Player 1 | Player 2 |
|---|---|---|---|
| Mean % of effective moves | 80.41 | 70.82 | 90.00 |
| Mean no. of effective moves | 4.28 | 4.81 | 3.75 |
| Effective game space | 10^16.20 | 10^8.72 | 10^7.48 |
| Mean % of good moves | 34.67 | 23.50 | 45.83 |
| Mean no. of good moves | 1.91 | 0.88 | 2.94 |
| Good move game space | 10^7.35 | 10^1.56 | 10^5.79 |
These figures were calculated over a single game.
An effective move is one with score 0.1 of the best move (including the best move). -1 (loss) <= score <= 1 (win)
A good move has a score > 0. Note that when there are no good moves, an multiplier of 1 is used for the game space calculation.
| Measure | Value | Description |
|---|---|---|
| Hot turns | 34.38% | A hot turn is one where making a move is better than doing nothing. |
| Momentum | 12.50% | % of turns where a player improved their score. |
| Correction | 21.88% | % of turns where the score headed back towards equality. |
| Depth | 3.81% | Difference in evaluation between a short and long search. |
| Drama | 1.93% | How much the winner was behind before their final victory. |
| Foulup Factor | 28.12% | Moves that looked better than the best move after a short search. |
| Surprising turns | 0.00% | Turns that looked bad after a short search, but good after a long one. |
| Last lead change | 53.12% | Distance through game when the lead changed for the last time. |
| Decisiveness | 50.00% | Distance from the result being known to the end of the game. |
These figures were calculated over a single representative* game, and based on the measures of quality described in "Automatic Generation and Evaluation of Recombination Games" (Cameron Browne, 2007). (* Representative, in the sense that it is close to the mean game length.)
| Moves | Animation |
|---|---|
| a1-g1,d1-c1,i1-a1,f1-h1,g1-i1,h1-d1,a1-f1,c1-g1,b1-a1,e1-b1 |  |
| a1-g1,f1-h1,i1-a1,d1-c1,g1-i1,h1-d1,a1-f1,c1-g1,b1-a1,e1-b1 |  |
| i1-g1,d1-c1,a1-i1,f1-h1,g1-a1,h1-d1,a1-f1,c1-g1,b1-a1,e1-b1 |  |
| i1-g1,f1-h1,a1-i1,d1-c1,g1-a1,h1-d1,a1-f1,c1-g1,b1-a1,e1-b1 |  |
| a1-g1,d1-h1,g1-d1,f1-g1,i1-c1,h1-a1,b1-i1,g1-h1,i1-g1 |  |
| a1-g1,d1-h1,g1-d1,h1-a1,i1-c1,f1-g1,b1-i1,g1-h1,i1-g1 |  |
| a1-g1,d1-h1,i1-c1,h1-a1,g1-d1,f1-g1,b1-i1,g1-h1,i1-g1 |  |
| a1-h1,d1-g1,h1-d1,g1-a1,i1-c1,f1-g1,b1-i1,g1-h1,i1-g1 |  |
| a1-h1,d1-g1,i1-c1,g1-a1,h1-d1,f1-g1,b1-i1,g1-h1,i1-g1 |  |
| a1-h1,f1-c1,b1-g1,d1-f1,i1-a1,c1-d1,h1-b1,e1-i1,a1-c1 |  |
| a1-h1,f1-c1,i1-a1,d1-f1,b1-g1,c1-d1,h1-b1,e1-i1,a1-c1 |  |
| b1-g1,f1-c1,a1-h1,d1-f1,i1-a1,c1-d1,h1-b1,e1-i1,a1-c1 |  |
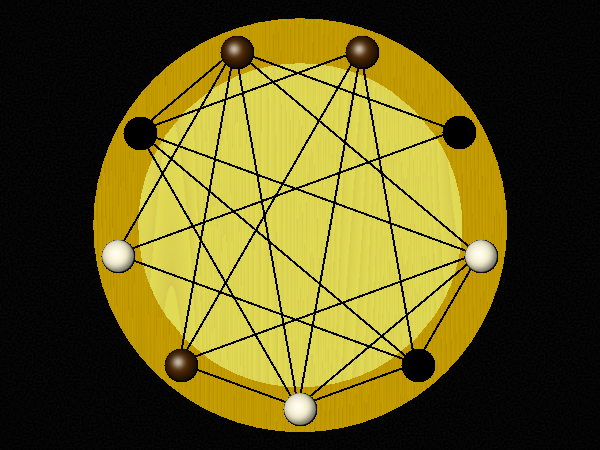
Colour shows the success ratio of this play over the first 10moves; black < red < yellow < white.
Size shows the frequency this move is played.
| 0 | 1 | 2 | 3 | 4 | 5 | 6 | 7 | 8 |
|---|---|---|---|---|---|---|---|---|
| 1 | 9 | 90 | 711 | 5274 | 36027 | 234216 | 1422117 | 8156997 |
Note: most games do not take board rotation and reflection into consideration.
Multi-part turns could be treated as the same or different depth depending on the implementation.
Counts to depth N include all moves reachable at lower depths.
Inaccuracies may also exist due to hash collisions, but Ai Ai uses 64-bit hashes so these will be a very small fraction of a percentage point.
No solutions found to depth 8.
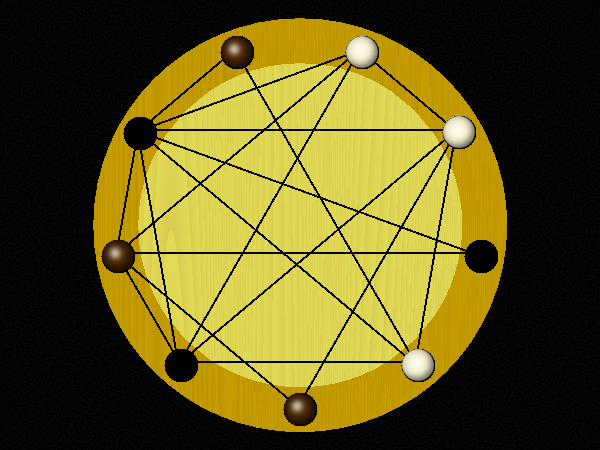
| Puzzle | Solution |
|---|---|
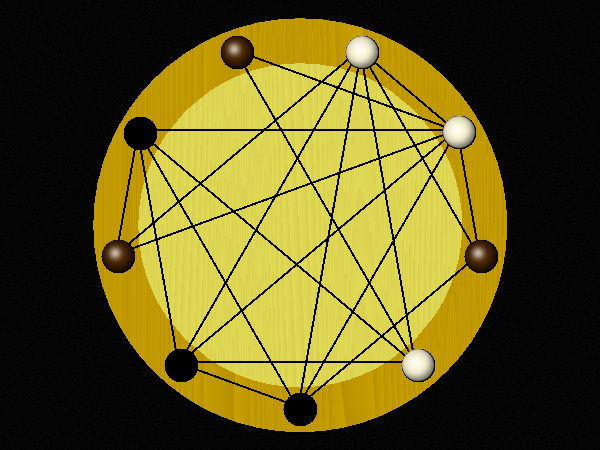
 White to win in 20 moves | |
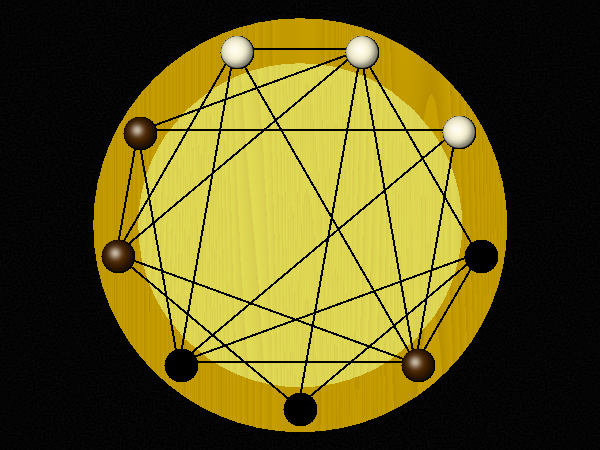
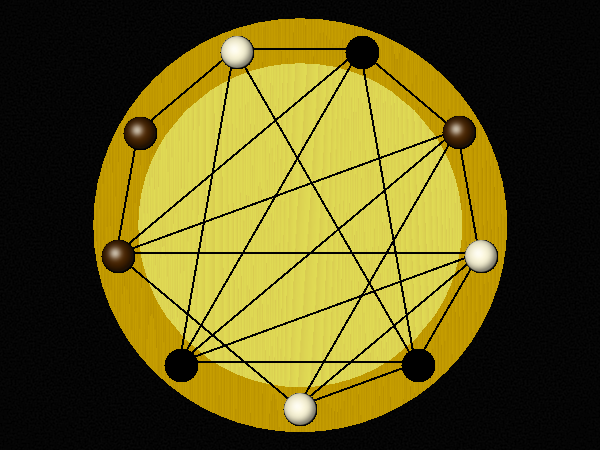
 White to win in 18 moves | |
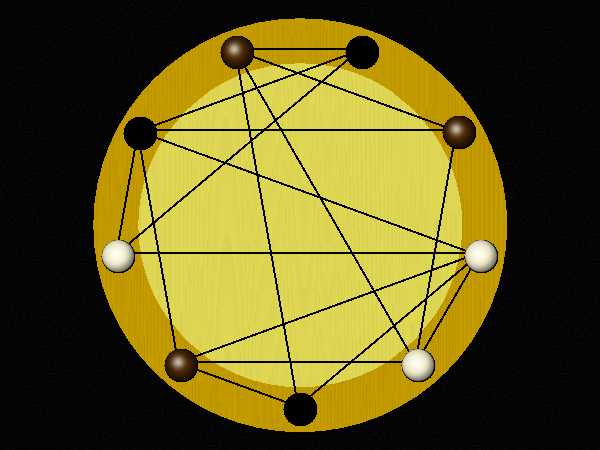
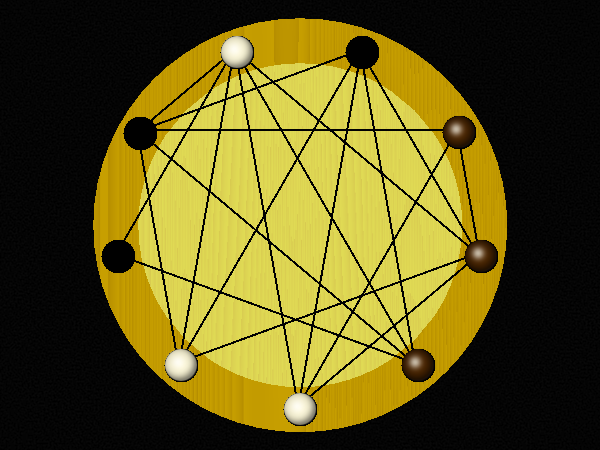
 White to win in 18 moves | |
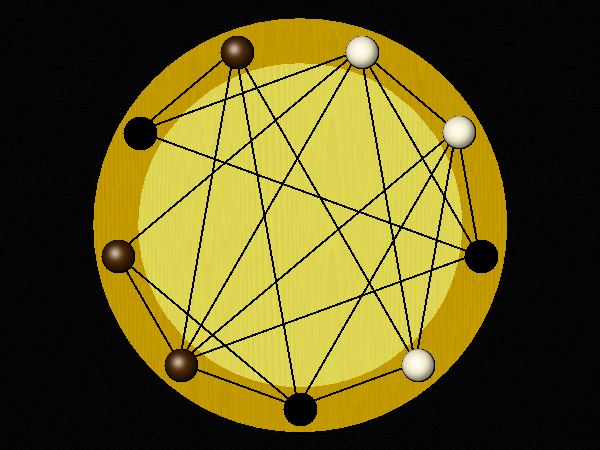
 White to win in 20 moves | |
 White to win in 20 moves | |
 White to win in 20 moves | |
 Black to win in 18 moves | |
 White to win in 18 moves | |
 White to win in 20 moves | |
 Black to win in 20 moves | |
 White to win in 20 moves | |
 White to win in 22 moves |
Selection criteria: first move must be unique, and not forced to avoid losing. Beyond that, Puzzles will be rated by the product of [total move]/[best moves] at each step, and the best puzzles selected.