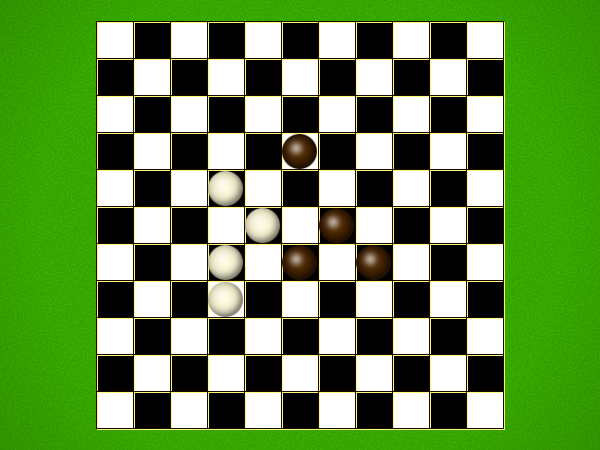
A make-a-line game inspired by M. C. Escher's Dag en Nacht
Generated at 29/07/2021, 14:35 from 1000 logged games.
Rules
Representative game (in the sense of being of mean length). Wherever you see the 'representative game' referred to in later sections, this is it!
Place a piece of your colour on a DARK square, or move a piece in play one step orthogonally. First to make a row of 5 orthogonal, or a diagonal line of 4 on LIGHT squares wins.
Ai Ai calculates the size of the implementation, and compares it to the Ai Ai implementation of the simplest possible game (which just fills the board). Note that this estimate may include some graphics and heuristics code as well as the game logic. See the wikipedia entry for more details.
Playout Complexity Estimate
Playouts per second
14186.71 (70.49µs/playout)
Reference Size
550024.75 (1.82µs/playout)
Ratio (low is good)
38.77
Tavener complexity: the heat generated by playing every possible instance of a game with a perfectly efficient programme. Since this is not possible to calculate, Ai Ai calculates the number of random playouts per second and compares it to the fastest non-trivial Ai Ai game (Connect 4). This ratio gives a practical indication of how complex the game is. Combine this with the computational state space, and you can get an idea of how strong the default (MCTS-based) AI will be.
Playout/Search Speed
Label
Its/s
SD
Nodes/s
SD
Game length
SD
Random playout
18,717
347
1,705,958
30,915
91
21
search.UCT
NaN
NaN
0
0
search.AlphaBeta
NaN
NaN
0
0
Random: 10 second warmup for the hotspot compiler. 100 trials of 1000ms each.
Other: 100 playouts, means calculated over the first 5 moves only to avoid distortion due to speedup at end of game.
Mirroring Strategies
Rotation (Half turn) lost each game as expected.
Reflection (X axis) lost each game as expected.
Reflection (Y axis) lost each game as expected.
Copy last move lost each game as expected.
Mirroring strategies attempt to copy the previous move. On first move, they will attempt to play in the centre. If neither of these are possible, they will pick a random move. Each entry represents a different form of copying; direct copy, reflection in either the X or Y axis, half-turn rotation.
Heuristic Values
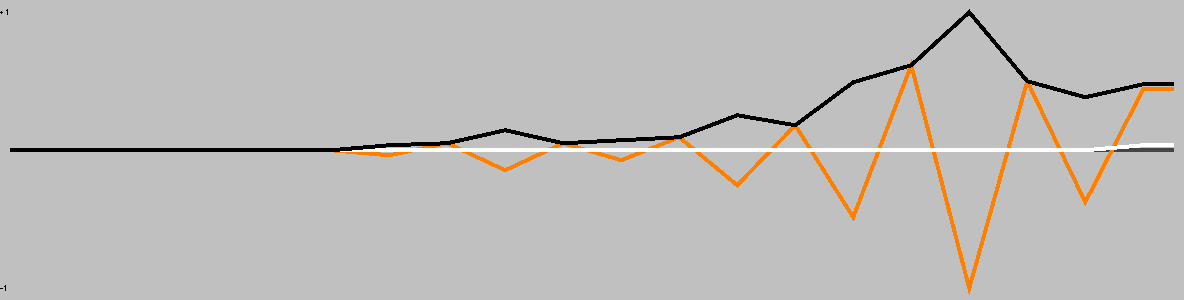
This chart shows the heuristic values thoughout a single representative* game. The orange line shows the difference between player scores. (* Representative, in the sense that it is close to the mean game length.)
Win % By Player (Bias)
1: White win %
77.10±2.71
Includes draws = 50%
2: Black win %
22.90±2.50
Includes draws = 50%
Draw %
0.00
Percentage of games where all players draw.
Decisive %
100.00
Percentage of games with a single winner.
Samples
1000
Quantity of logged games played
Note: that win/loss statistics may vary depending on thinking time (horizon effect, etc.), bad heuristics, bugs, and other factors, so should be taken with a pinch of salt. (Given perfect play, any game of pure skill will always end in the same result.)
Note: Ai Ai differentiates between states where all players draw or win or lose; this is mostly to support cooperative games.
UCT Skill Chains
Match
AI
Strong Wins
Draws
Strong Losses
#Games
Strong Score
p1 Win%
Draw%
p2 Win%
Game Length
0
Random
1
UCT (its=2)
631
0
369
1000
0.6006 <= 0.6310 <= 0.6604
50.10
0.00
49.90
85.84
24
UCT (its=25)
631
0
366
997
0.6025 <= 0.6329 <= 0.6623
50.55
0.00
49.45
81.48
58
UCT (its=59)
526
0
474
1000
0.4950 <= 0.5260 <= 0.5568
51.00
0.00
49.00
78.65
59
UCT (its=59)
489
0
511
1000
0.4581 <= 0.4890 <= 0.5200
49.10
0.00
50.90
78.56
Search for levels ended: time limit reached.
Level of Play: Strong beats Weak 60% of the time (lower bound with 95% confidence).
Draw%, p1 win% and game length may give some indication of trends as AI strength increases.
1st Player Win Ratios by Playing Strength
This chart shows the win(green)/draw(black)/loss(red) percentages, as UCT play strength increases. Note that for most games, the top playing strength show here will be distinctly below human standard.
Complexity
Game length
19.96
Branching factor
65.33
Complexity
10^36.23
Based on game length and branching factor
Samples
1000
Quantity of logged games played
Move Classification
Distinct actions
280
Number of distinct moves (e.g. "e4") regardless of position in game tree
Good moves
118
A good move is selected by the AI more than the average
Bad moves
162
A bad move is selected by the AI less than the average
Response distance
3.78
Mean distance between move and response; a low value relative to the board size may mean a game is tactical rather than strategic.
Samples
1000
Quantity of logged games played
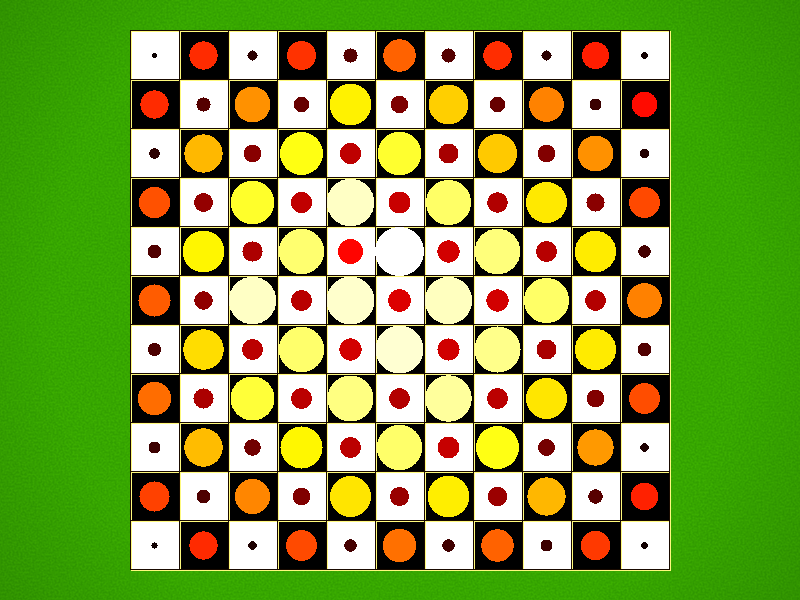
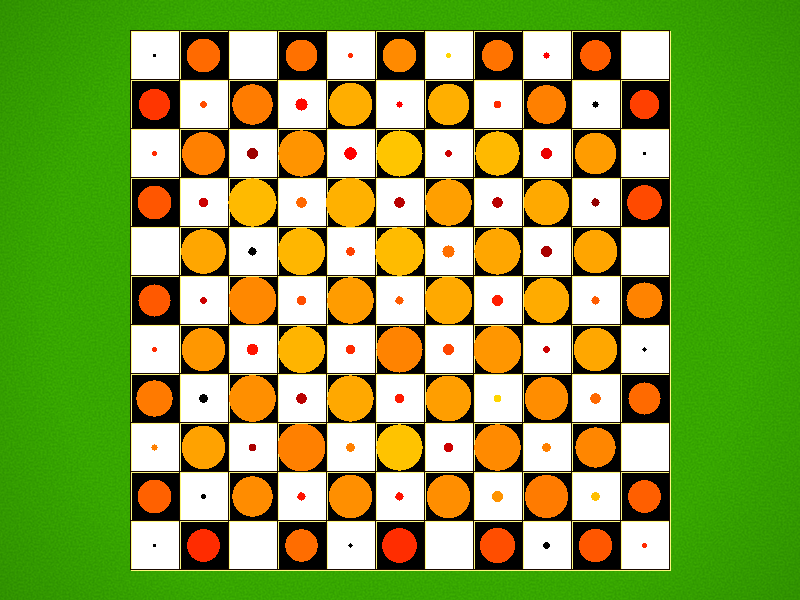
Board Coverage
A mean of 15.87% of board locations were used per game.
Colour and size show the frequency of visits.
Game Length
Game length frequencies.
Mean
19.96
Mode
[15]
Median
19.0
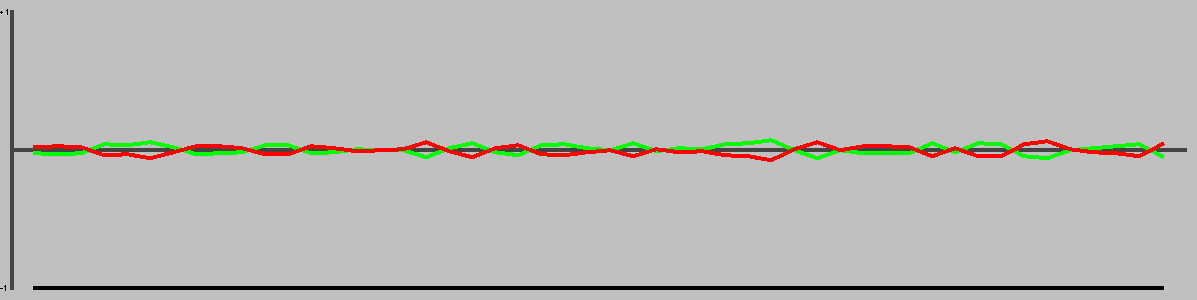
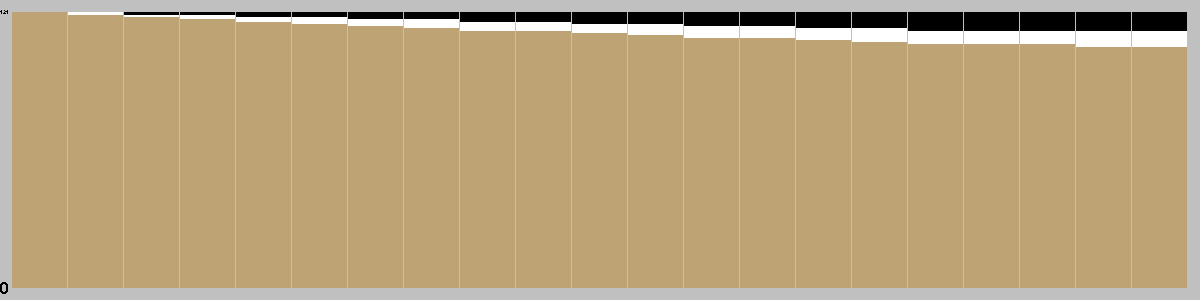
Change in Material Per Turn
This chart is based on a single representative* playout, and gives a feel for the change in material over the course of a game. (* Representative in the sense that it is close to the mean length.)
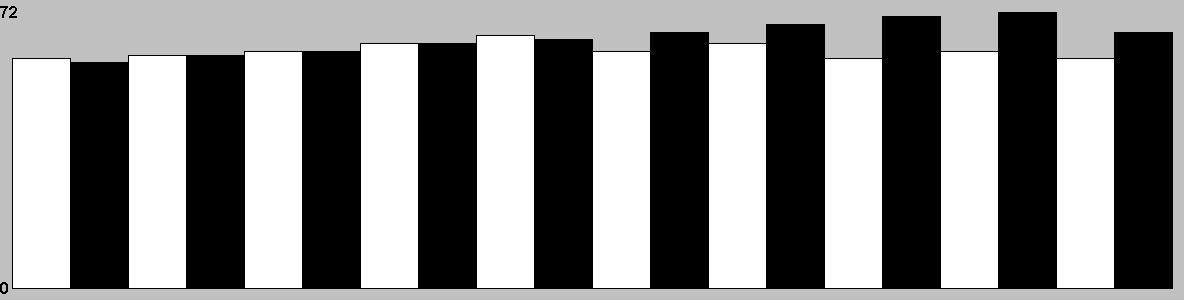
Actions/turn
Table: branching factor per turn, based on a single representative* game. (* Representative in the sense that it is close to the mean game length.)
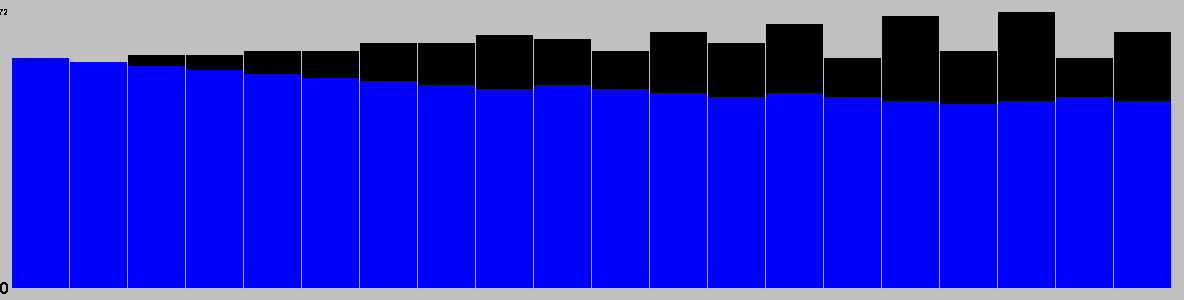
Action Types per Turn
This chart is based on a single representative* game, and gives a feel for the types of moves available throughout that game. (* Representative in the sense that it is close to the mean game length.)
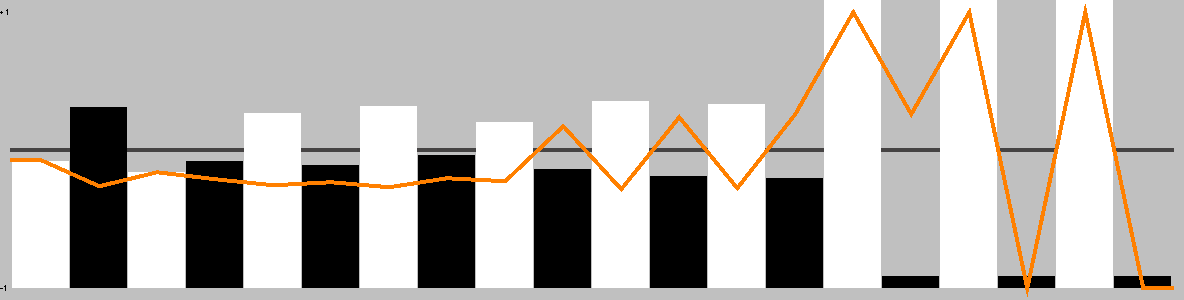
This chart shows the best move value with respect to the active player; the orange line represents the value of doing nothing (null move).
The lead changed on 5% of the game turns. Ai Ai found 1 critical turn (turns with only one good option).
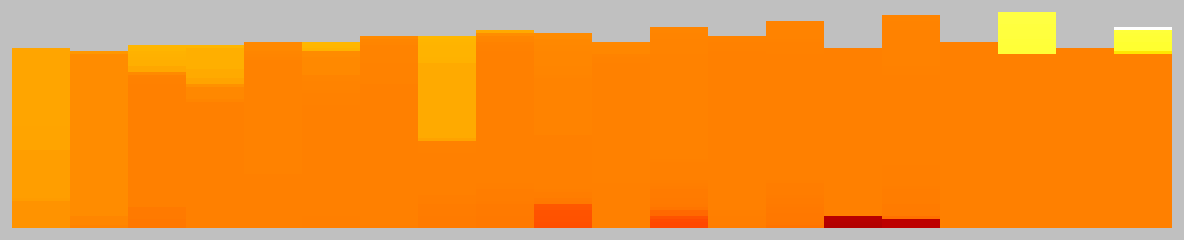
Position Heatmap
This chart shows the relative temperature of all moves each turn. Colour range: black (worst), red, orange(even), yellow, white(best).
Good/Effective moves
Measure
All players
Player 1
Player 2
Mean % of effective moves
64.46
83.27
45.66
Mean no. of effective moves
40.50
51.50
29.50
Effective game space
10^26.58
10^16.32
10^10.26
Mean % of good moves
44.97
40.96
48.97
Mean no. of good moves
28.90
24.80
33.00
Good move game space
10^20.46
10^8.05
10^12.41
These figures were calculated over a single game.
An effective move is one with score 0.1 of the best move (including the best move). -1 (loss) <= score <= 1 (win)
A good move has a score > 0. Note that when there are no good moves, an multiplier of 1 is used for the game space calculation.
Quality Measures
Measure
Value
Description
Hot turns
85.00%
A hot turn is one where making a move is better than doing nothing.
Momentum
30.00%
% of turns where a player improved their score.
Correction
25.00%
% of turns where the score headed back towards equality.
Depth
5.20%
Difference in evaluation between a short and long search.
Drama
1.14%
How much the winner was behind before their final victory.
Foulup Factor
70.00%
Moves that looked better than the best move after a short search.
Surprising turns
0.00%
Turns that looked bad after a short search, but good after a long one.
Last lead change
20.00%
Distance through game when the lead changed for the last time.
Decisiveness
30.00%
Distance from the result being known to the end of the game.
These figures were calculated over a single representative* game, and based on the measures of quality described in "Automatic Generation and Evaluation of Recombination Games" (Cameron Browne, 2007). (* Representative, in the sense that it is close to the mean game length.)
Openings
Moves
Animation
j9,g6,h9
f11,k2,h3
j5,b9,a4
a4,k6,j1
Opening Heatmap
Colour shows the success ratio of this play over the first 10moves; black < red < yellow < white.
Size shows the frequency this move is played.
Positions Reachable at Depth (Includes Transpositions)
0
1
2
3
4
1
60
3600
221900
13490784
Note: most games do not take board rotation and reflection into consideration. Multi-part turns could be treated as the same or different depth depending on the implementation. Counts to depth N include all moves reachable at lower depths. Zobrist hashes are not available for this game, so transpositions are included in the counts.
Shortest Game(s)
No solutions found to depth 4.
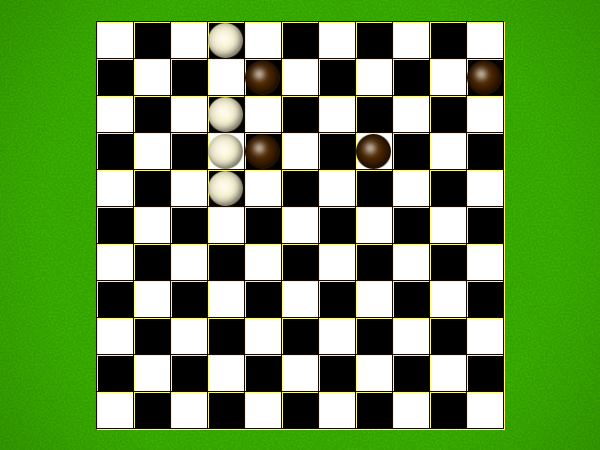
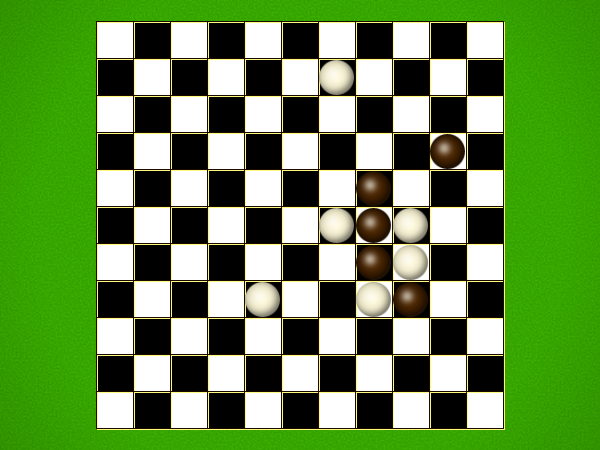
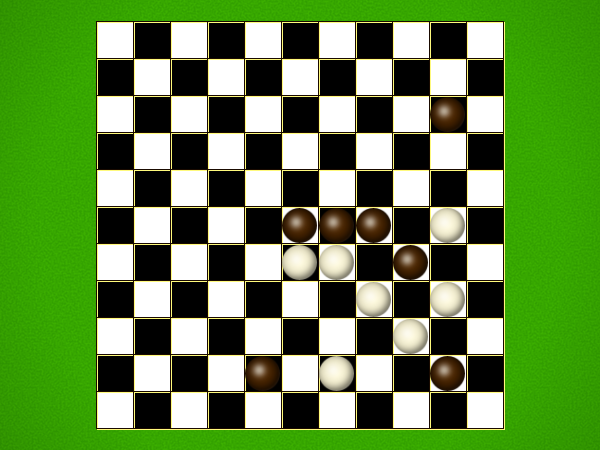
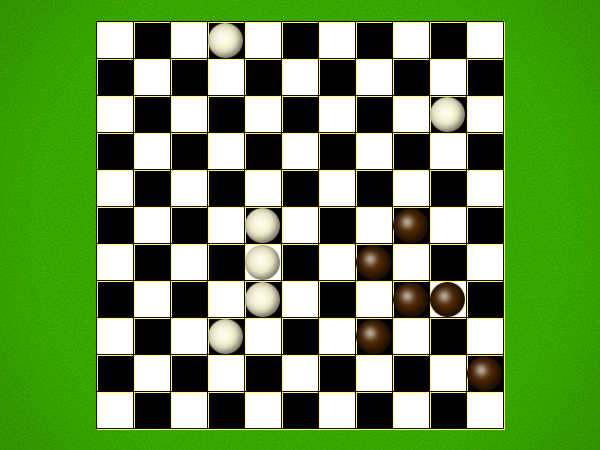
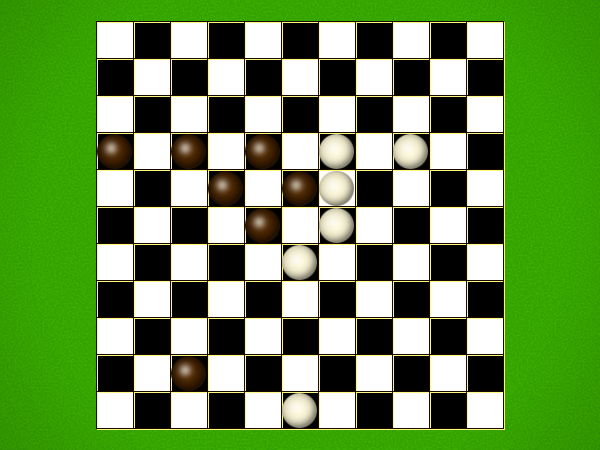
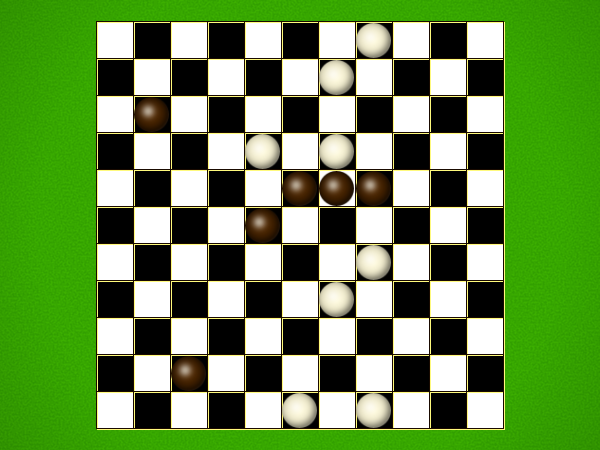
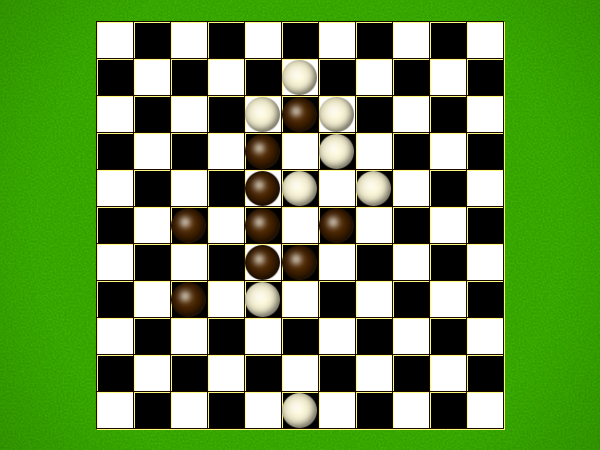
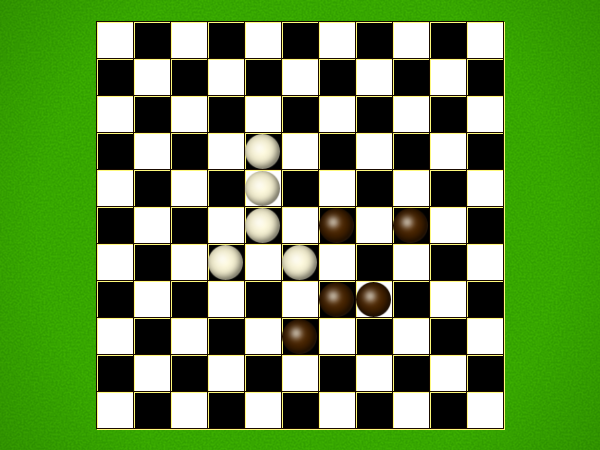
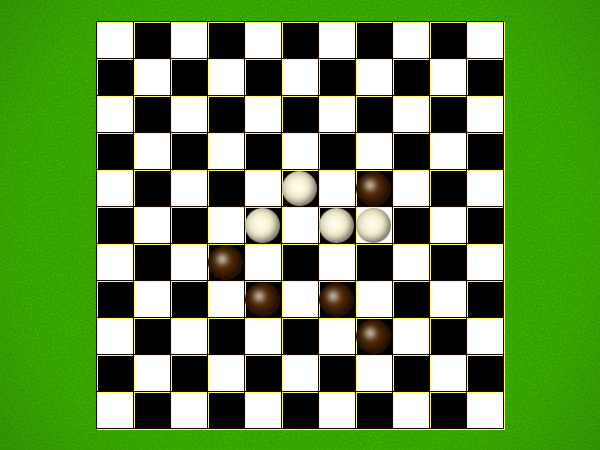
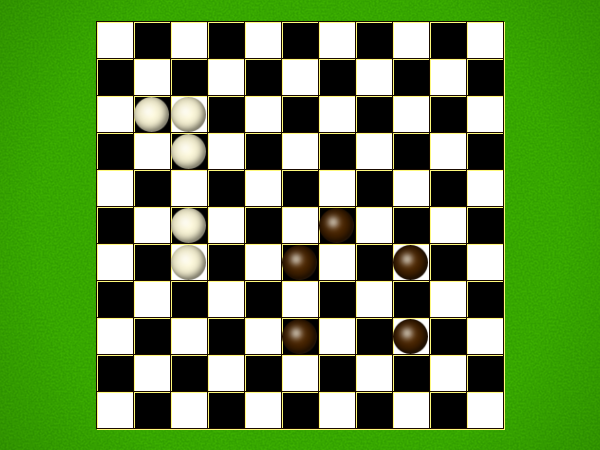
Puzzles
Puzzle
Solution
White to win in 5 moves
Black to win in 5 moves
Black to win in 5 moves
White to win in 5 moves
White to win in 5 moves
Black to win in 5 moves
White to win in 3 moves
White to win in 3 moves
White to win in 3 moves
White to win in 3 moves
White to win in 3 moves
White to win in 3 moves
Weak puzzle selection criteria are in place; the first move may not be unique.