Full Report for Dodo by Mark Steere

Full Report for Dodo by Mark Steere

Generated at 05/08/2021, 10:33 from 1000 logged games.

Rules

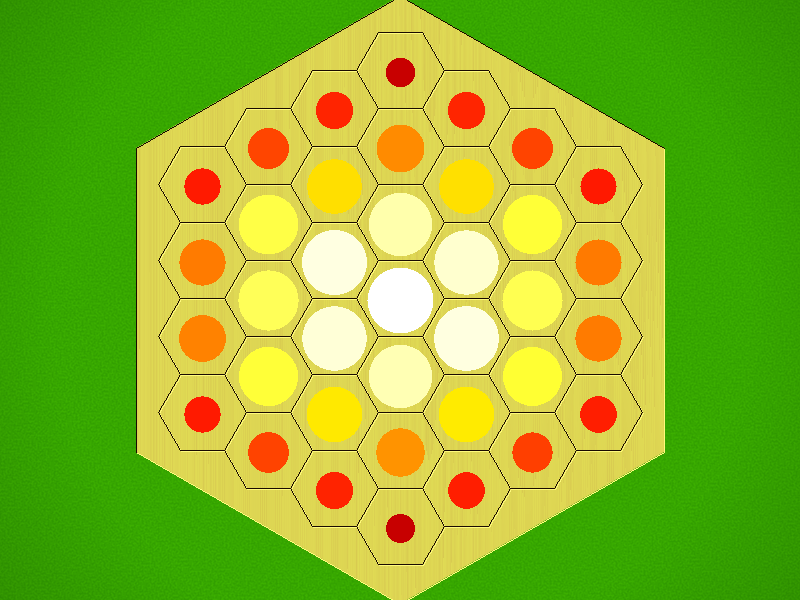
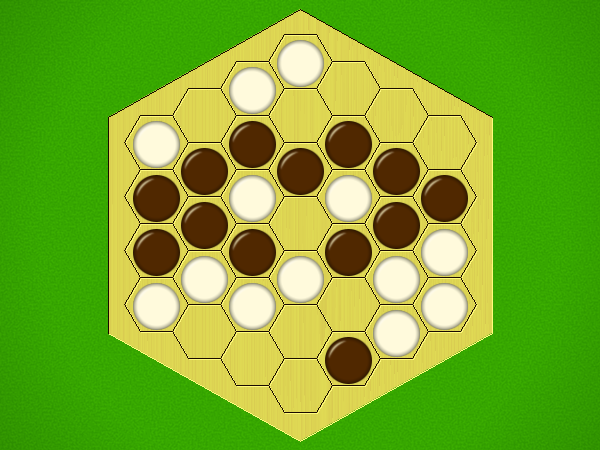
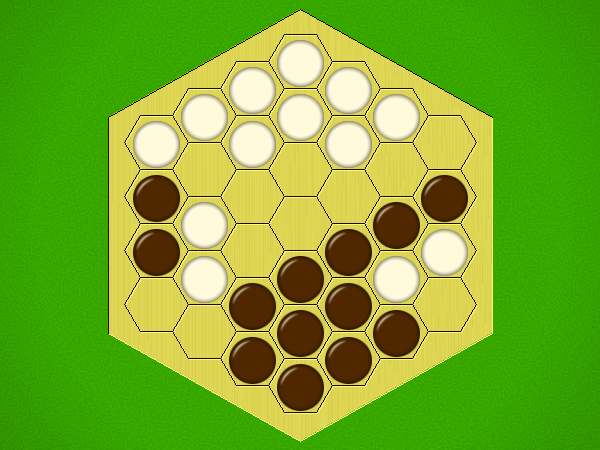
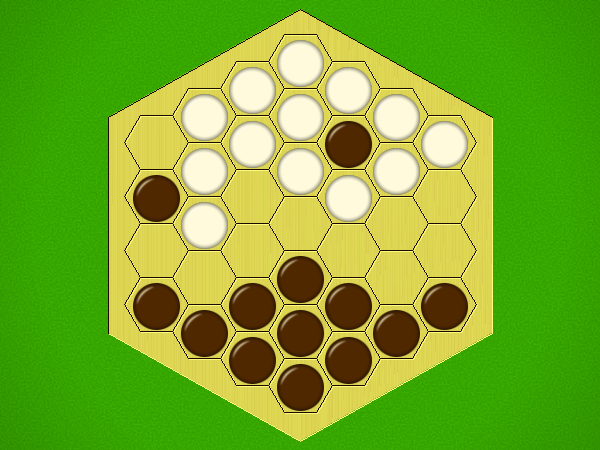
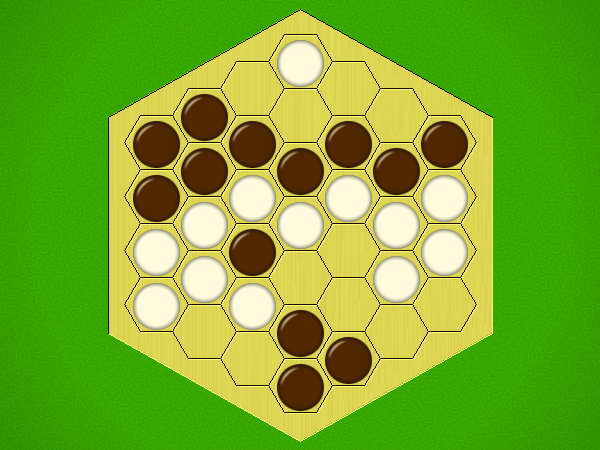
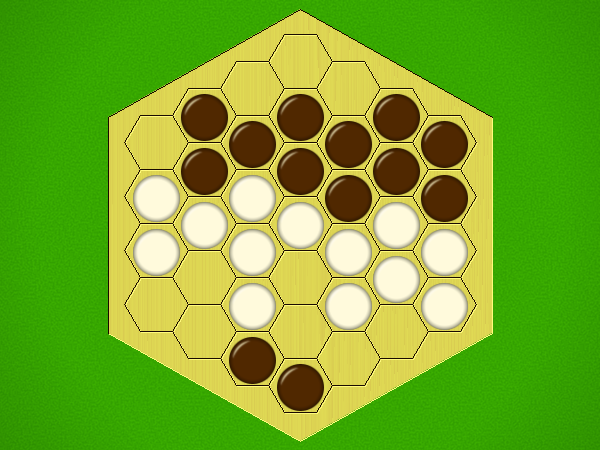
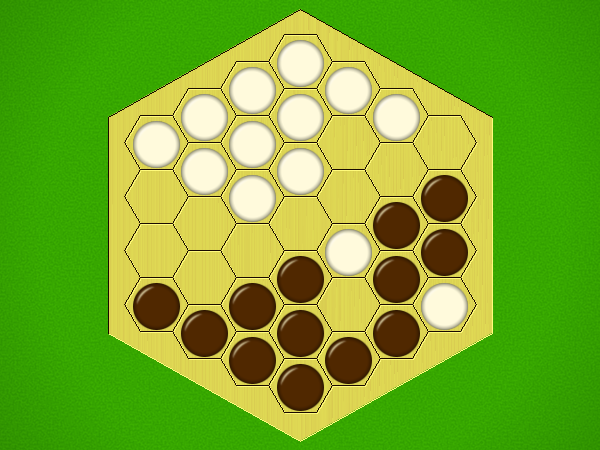
Representative game (in the sense of being of mean length). Wherever you see the 'representative game' referred to in later sections, this is it!

INTRODUCTION

Dodo is a two player game played on a hexagonal grid of any size. The two players, Red and Blue, take turns moving their own checkers, one checker per turn, starting with Red. Players are not allowed to pass. Mark Steere designed Dodo in May, 2021.

MOVES

All moves are to unoccupied cells. Players can move their checkers one cell directly forward or diagonally forward. Unlike Chinese Checkers, there is no jumping or capturing in Dodo.

OBJECT OF THE GAME

If at the beginning of your turn you have no moves available, you win.

Miscellaneous

General comments:

Play: Combinatorial

BGG Stats

BGG EntryDodo
BGG Ratingnull
#Votersnull
SDnull
BGG Weightnull
#Votersnull
Yearnull

Kolomogorov Complexity Analysis

Size (bytes)24361
Reference Size10293
Ratio2.37

Ai Ai calculates the size of the implementation, and compares it to the Ai Ai implementation of the simplest possible game (which just fills the board). Note that this estimate may include some graphics and heuristics code as well as the game logic. See the wikipedia entry for more details.

Playout Complexity Estimate

Playouts per second66649.34 (15.00µs/playout)
Reference Size597442.94 (1.67µs/playout)
Ratio (low is good)8.96

Tavener complexity: the heat generated by playing every possible instance of a game with a perfectly efficient programme. Since this is not possible to calculate, Ai Ai calculates the number of random playouts per second and compares it to the fastest non-trivial Ai Ai game (Connect 4). This ratio gives a practical indication of how complex the game is. Combine this with the computational state space, and you can get an idea of how strong the default (MCTS-based) AI will be.

State Space Complexity

% new positions/bucket

State Space Complexity39313690 
State Space Complexity (log 10)7.59 
Confidence29.260: totally unreliable, 100: perfect
Samples739753 

State space complexity (where present) is an estimate of the number of distinct game tree reachable through actual play. Over a series of random games, Ai Ai checks each position to see if it is new, or a repeat of a previous position and keeps a total for each game. As the number of games increase, the quantity of new positions seen per game decreases. These games are then partitioned into a number of buckets, and if certain conditions are met, Ai Ai treats the number in each bucket as the start of a strictly decreasing geometric sequence and sums it to estimate the total state space. The accuracy is calculated as 1-[end bucket count]/[starting bucklet count]

Playout/Search Speed

LabelIts/sSDNodes/sSDGame lengthSD
Random playout118,9563,8647,069,894230,0095927
search.UCT121,4857,40011131

Random: 10 second warmup for the hotspot compiler. 100 trials of 1000ms each.

Other: 100 playouts, means calculated over the first 5 moves only to avoid distortion due to speedup at end of game.

Mirroring Strategies

Rotation (Half turn) lost each game as expected.
Reflection (X axis) lost each game as expected.
Reflection (Y axis) lost each game as expected.
Copy last move lost each game as expected.

Mirroring strategies attempt to copy the previous move. On first move, they will attempt to play in the centre. If neither of these are possible, they will pick a random move. Each entry represents a different form of copying; direct copy, reflection in either the X or Y axis, half-turn rotation.

Win % By Player (Bias)

1: White win %51.30±3.10Includes draws = 50%
2: Black win %48.70±3.09Includes draws = 50%
Draw %0.00Percentage of games where all players draw.
Decisive %100.00Percentage of games with a single winner.
Samples1000Quantity of logged games played

Note: that win/loss statistics may vary depending on thinking time (horizon effect, etc.), bad heuristics, bugs, and other factors, so should be taken with a pinch of salt. (Given perfect play, any game of pure skill will always end in the same result.)

Note: Ai Ai differentiates between states where all players draw or win or lose; this is mostly to support cooperative games.

UCT Skill Chains

MatchAIStrong WinsDrawsStrong Losses#GamesStrong Scorep1 Win%Draw%p2 Win%Game Length
0Random         
1UCT (its=2)63102558860.6815 <= 0.7122 <= 0.741050.110.0049.8959.57
3UCT (its=4)63103559860.6095 <= 0.6400 <= 0.669349.490.0050.5160.55
7UCT (its=8)63103459760.6160 <= 0.6465 <= 0.675953.180.0046.8263.63
13UCT (its=35)63101527830.7767 <= 0.8059 <= 0.832150.700.0049.3063.87
14UCT (its=96)63102598900.6783 <= 0.7090 <= 0.737949.210.0050.7970.31
15UCT (its=261)63102488790.6872 <= 0.7179 <= 0.746654.490.0045.5171.52
16UCT (its=710)63102348650.6989 <= 0.7295 <= 0.758049.020.0050.9875.60
17UCT (its=1929)63102578880.6799 <= 0.7106 <= 0.739547.640.0052.3684.13
18UCT (its=5245)63102478780.6880 <= 0.7187 <= 0.747451.480.0048.5290.22
19
UCT (its=14256)
425
0
146
571
0.7070 <= 0.7443 <= 0.7784
54.12
0.00
45.88
93.69
20
UCT (its=14256)
506
0
494
1000
0.4750 <= 0.5060 <= 0.5369
53.60
0.00
46.40
98.83

Search for levels ended: time limit reached.

Level of Play: Strong beats Weak 60% of the time (lower bound with 95% confidence).

Draw%, p1 win% and game length may give some indication of trends as AI strength increases.

1st Player Win Ratios by Playing Strength

This chart shows the win(green)/draw(black)/loss(red) percentages, as UCT play strength increases. Note that for most games, the top playing strength show here will be distinctly below human standard.

Complexity

Game length105.81 
Branching factor6.54 
Complexity10^73.93Based on game length and branching factor
Samples1000Quantity of logged games played

Computational complexity (where present) is an estimate of the game tree reachable through actual play. For each game in turn, Ai Ai marks the positions reached in a hashtable, then counts the number of new moves added to the table. Once all moves are applied, it treats this sequence as a geometric progression and calculates the sum as n-> infinity.

Move Classification

Board Size37Quantity of distinct board cells
Distinct actions181Quantity of distinct moves (e.g. "e4") regardless of position in game tree
Good moves106A good move is selected by the AI more than the average
Bad moves74A bad move is selected by the AI less than the average
Response distance%43.63%Distance from move to response / maximum board distance; a low value suggests a game is tactical rather than strategic.
Samples1000Quantity of logged games played

Board Coverage

A mean of 97.31% of board locations were used per game.

Colour and size show the frequency of visits.

Game Length

Game length frequencies.

Mean105.81
Mode[133]
Median127.0

Change in Material Per Turn

Mean change in material/round0.00Complete round of play (all players)

This chart is based on a single representative* playout, and gives a feel for the change in material over the course of a game. (* Representative in the sense that it is close to the mean length.)

Actions/turn

Table: branching factor per turn, based on a single representative* game. (* Representative in the sense that it is close to the mean game length.)

Action Types per Turn

This chart is based on a single representative* game, and gives a feel for the types of moves available throughout that game. (* Representative in the sense that it is close to the mean game length.)

Red: removal, Black: move, Blue: Add, Grey: pass, Purple: swap sides, Brown: other.

Trajectory

This chart shows the best move value with respect to the active player; the orange line represents the value of doing nothing (null move).

The lead changed on 8% of the game turns. Ai Ai found 13 critical turns (turns with only one good option).

Position Heatmap

This chart shows the relative temperature of all moves each turn. Colour range: black (worst), red, orange(even), yellow, white(best).

Good/Effective moves

MeasureAll playersPlayer 1Player 2
Mean % of effective moves63.1375.2750.99
Mean no. of effective moves3.313.583.04
Effective game space10^37.9710^19.2610^18.71
Mean % of good moves35.4336.1434.72
Mean no. of good moves1.851.522.17
Good move game space10^23.2210^10.5210^12.71

These figures were calculated over a single game.

An effective move is one with score 0.1 of the best move (including the best move). -1 (loss) <= score <= 1 (win)

A good move has a score > 0. Note that when there are no good moves, an multiplier of 1 is used for the game space calculation.

Quality Measures

MeasureValueDescription
Hot turns62.50%A hot turn is one where making a move is better than doing nothing.
Momentum17.31%% of turns where a player improved their score.
Correction28.85%% of turns where the score headed back towards equality.
Depth6.80%Difference in evaluation between a short and long search.
Drama5.26%How much the winner was behind before their final victory.
Foulup Factor38.46%Moves that looked better than the best move after a short search.
Surprising turns7.69%Turns that looked bad after a short search, but good after a long one.
Last lead change67.31%Distance through game when the lead changed for the last time.
Decisiveness35.58%Distance from the result being known to the end of the game.

These figures were calculated over a single representative* game, and based on the measures of quality described in "Automatic Generation and Evaluation of Recombination Games" (Cameron Browne, 2007). (* Representative, in the sense that it is close to the mean game length.)

Openings

MovesAnimation
c4-d3,f3-e3,b5-c4,e5-d5,b4-b5,f5-e5,a4-b4,f4-f3
d2-d3,e4-e3,d3-e2,e3-d4,c3-d3,e5-d5,b3-c3
b5-c5,e4-d4,a7-b7,e5-e4,a6-a7,e4-e3,b4-b5
b5-c5,e5-d5,a7-b7,d5-d4,a6-a7,e4-e3,b4-b5
b6-c6,e4-e3,a7-b6,f4-e4,a6-a7,d6-d5,a5-a6
a7-b7,e4-d4,b5-c5,e5-e4,a6-a7,e4-e3,b4-b5
a7-b7,e5-d5,b5-c5,d5-d4,a6-a7,e4-e3,b4-b5
a7-b7,e4-e3,b7-c6,f4-e4,a6-a7,d6-d5,a5-a6
d2-e1,e4-e3,e1-e2,e3-d4,c3-d3,e5-d5,b3-c3
c4-d3,f3-e3,b5-c4,e5-d5,b4-b5,f5-e5,a4-b4
b6-b7,d6-c7,b7-c6,d7-d6,c4-d4,f2-f1
c4-d4,d6-c7,b6-c5,d7-d6,c5-c6,f2-f1

Opening Heatmap

Colour shows the success ratio of this play over the first 10moves; black < red < yellow < white.

Size shows the frequency this move is played.

Unique Positions Reachable at Depth

0123456789
1131791478103485340324434592804132542899996598

Note: most games do not take board rotation and reflection into consideration.
Multi-part turns could be treated as the same or different depth depending on the implementation.
Counts to depth N include all moves reachable at lower depths.
Inaccuracies may also exist due to hash collisions, but Ai Ai uses 64-bit hashes so these will be a very small fraction of a percentage point.

Shortest Game(s)

No solutions found to depth 9.

Puzzles

PuzzleSolution

White to win in 27 moves

Black to win in 23 moves

White to win in 21 moves

Black to win in 7 moves

White to win in 13 moves

White to win in 13 moves

White to win in 5 moves

White to win in 7 moves

White to win in 3 moves

Black to win in 19 moves

Black to win in 15 moves

White to win in 13 moves

Selection criteria: first move must be unique, and not forced to avoid losing. Beyond that, Puzzles will be rated by the product of [total move]/[best moves] at each step, and the best puzzles selected.