Generated at 05/08/2021, 13:48 from 1000 logged games.
Rules
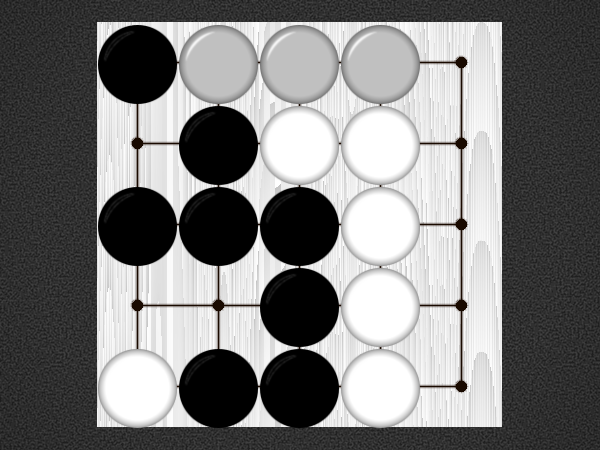
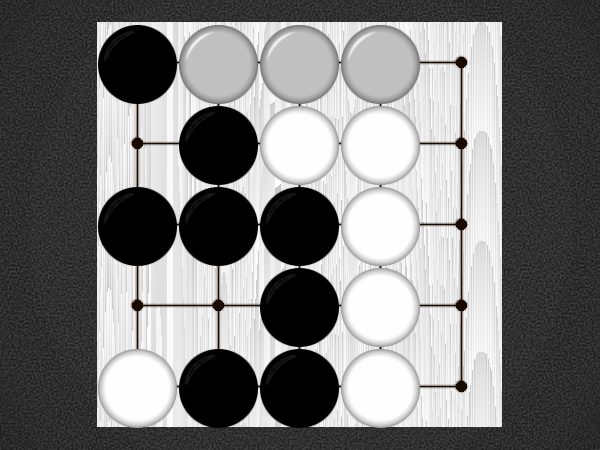
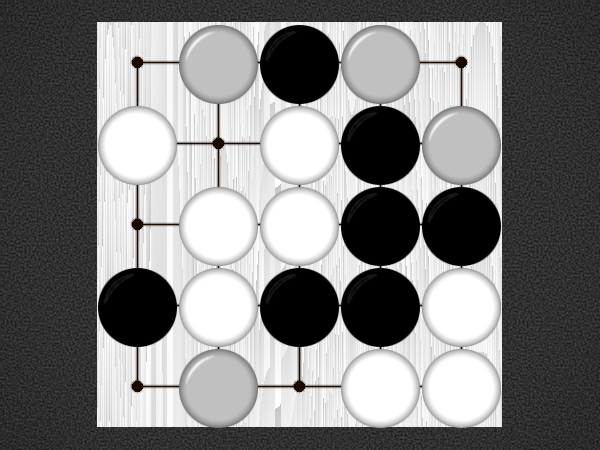
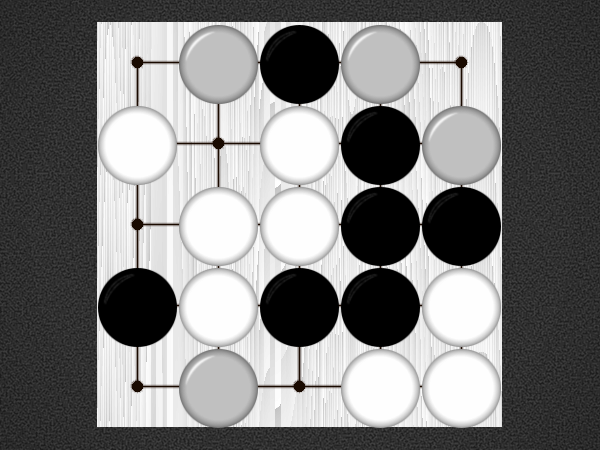
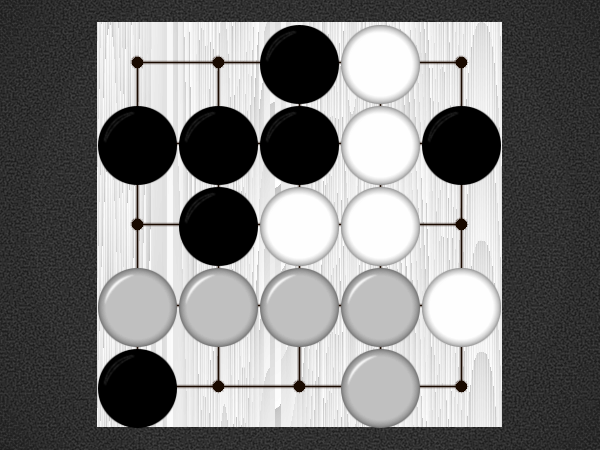
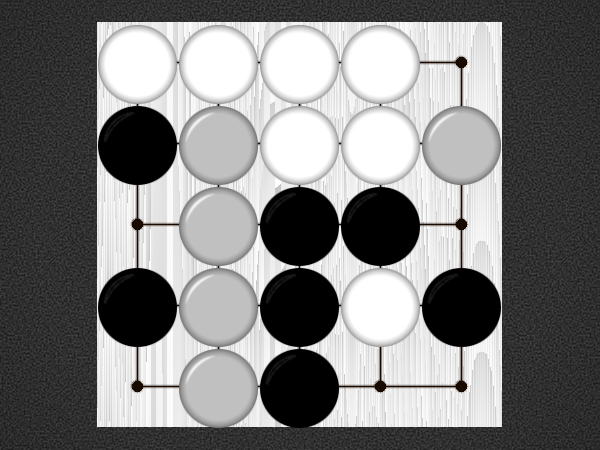
Representative game (in the sense of being of mean length). Wherever you see the 'representative game' referred to in later sections, this is it!
GoRoGo is new Go variant game for two players played with each 10 ordinary black and white pieces and 5 additional neutral ones. Each player has two of the neutral pieces, and one starts on the game board.
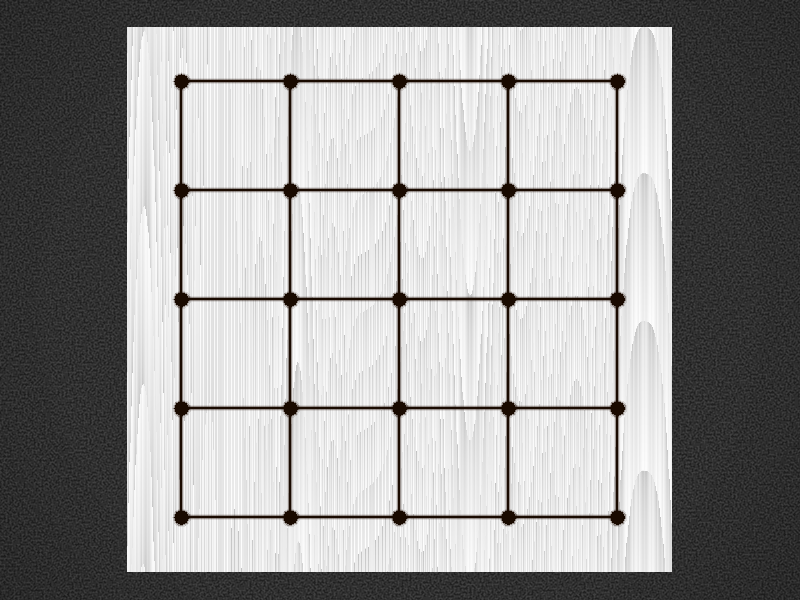
Like Go, the game is played on a grid, but the board has only a 5x5 grid with 25 intersections and 40 paths. The purpose of the game is to obtain more of your opponent's pieces, not to claim an area majority.
Since there are only 25 pieces, the game is over after 24 moves at most. A player cannot pass, nor play a neutral piece last. If they don't have a legal move, they lose.
The neutral pieces are both black and white. That is, on Black's turn, a neutral piece is a black piece. Then on White's turn, it is a white piece. This allows moves that are normally prohibited in Go, such as 'Kou'. A player can attack into an area that in Go would be protected.
GoRoGo is a GO game but not GO. It means that the tactics are GO tactics but the strategy isn't GO.
The neutral stones really do change the nature of the game, making it feel very different from go, and interesting on a small board; nonetheless, I suspect it has limited replay value.
Kaffedrake
4
A small claustrophobic tactical Go variant with neutral pieces. There are worse Go variants with neutral pieces.
Geeken
N/A
5.8KS 2020
nycavri
7
fogus
5.5
blakstar
8
AmadanNaBriona
N/A
Kickstarted.
bigglesbee
7
lizlam
9
A fun and simple Go variant.
OngPohHuatiLoveU
9
In SG & Wanna play? Telegram: OngPohHuatiLoveU
dwskoog
N/A
Numbered and signed mini board
mithoron
7
Jeff_Ten
7
yucv2006
6
pezpimp
5
Based on one play: A mini version of Go with a few neutral pieces, but not sure this is a worthwhile Go variant. The board is tiny so a mistake will cost you as it is tough to recover. At the end you are simply trying to surround your opponent with your pieces or the neutral ones in a 5 by 5 board.
Kolomogorov Complexity Analysis
Size (bytes)
24331
Reference Size
10293
Ratio
2.36
Ai Ai calculates the size of the implementation, and compares it to the Ai Ai implementation of the simplest possible game (which just fills the board). Note that this estimate may include some graphics and heuristics code as well as the game logic. See the wikipedia entry for more details.
Playout Complexity Estimate
Playouts per second
36433.06 (27.45µs/playout)
Reference Size
1373060.55 (0.73µs/playout)
Ratio (low is good)
37.69
Tavener complexity: the heat generated by playing every possible instance of a game with a perfectly efficient programme. Since this is not possible to calculate, Ai Ai calculates the number of random playouts per second and compares it to the fastest non-trivial Ai Ai game (Connect 4). This ratio gives a practical indication of how complex the game is. Combine this with the computational state space, and you can get an idea of how strong the default (MCTS-based) AI will be.
State Space Complexity
% new positions/bucket
State Space Complexity
2
State Space Complexity (log 10)
0.30
Confidence
100.00
0: totally unreliable, 100: perfect
Samples
1985070
State space complexity (where present) is an estimate of the number of distinct game tree reachable through actual play. Over a series of random games, Ai Ai checks each position to see if it is new, or a repeat of a previous position and keeps a total for each game. As the number of games increase, the quantity of new positions seen per game decreases. These games are then partitioned into a number of buckets, and if certain conditions are met, Ai Ai treats the number in each bucket as the start of a strictly decreasing geometric sequence and sums it to estimate the total state space. The accuracy is calculated as 1-[end bucket count]/[starting bucklet count]
Playout/Search Speed
Label
Its/s
SD
Nodes/s
SD
Game length
SD
Random playout
88,536
1,496
2,212,492
37,384
25
0
search.UCT
88,936
4,721
25
0
Random: 10 second warmup for the hotspot compiler. 100 trials of 1000ms each.
Other: 100 playouts, means calculated over the first 5 moves only to avoid distortion due to speedup at end of game.
Mirroring Strategies
Rotation (Half turn) lost each game as expected.
Reflection (X axis) lost each game as expected.
Reflection (Y axis) lost each game as expected.
Copy last move lost each game as expected.
Mirroring strategies attempt to copy the previous move. On first move, they will attempt to play in the centre. If neither of these are possible, they will pick a random move. Each entry represents a different form of copying; direct copy, reflection in either the X or Y axis, half-turn rotation.
Win % By Player (Bias)
1: White win %
72.90±2.84
Includes draws = 50%
2: Black win %
27.10±2.66
Includes draws = 50%
Draw %
11.80
Percentage of games where all players draw.
Decisive %
88.20
Percentage of games with a single winner.
Samples
1000
Quantity of logged games played
Note: that win/loss statistics may vary depending on thinking time (horizon effect, etc.), bad heuristics, bugs, and other factors, so should be taken with a pinch of salt. (Given perfect play, any game of pure skill will always end in the same result.)
Note: Ai Ai differentiates between states where all players draw or win or lose; this is mostly to support cooperative games.
UCT Skill Chains
Match
AI
Strong Wins
Draws
Strong Losses
#Games
Strong Score
p1 Win%
Draw%
p2 Win%
Game Length
0
Random
1
UCT (its=2)
600
61
278
939
0.6408 <= 0.6715 <= 0.7007
45.58
6.50
47.92
24.99
3
UCT (its=4)
592
77
315
984
0.6103 <= 0.6408 <= 0.6701
51.12
7.83
41.06
25.00
8
UCT (its=9)
581
99
318
998
0.6014 <= 0.6318 <= 0.6611
47.60
9.92
42.48
25.00
15
UCT (its=16)
579
103
309
991
0.6058 <= 0.6362 <= 0.6656
47.43
10.39
42.18
25.00
24
UCT (its=25)
593
75
329
997
0.6020 <= 0.6324 <= 0.6618
45.44
7.52
47.04
25.00
25
UCT (its=68)
604
54
180
838
0.7227 <= 0.7530 <= 0.7810
43.91
6.44
49.64
25.00
26
UCT (its=185)
605
52
134
791
0.7683 <= 0.7977 <= 0.8242
45.51
6.57
47.91
25.00
27
UCT (its=502)
601
60
167
828
0.7319 <= 0.7621 <= 0.7898
46.50
7.25
46.26
25.00
28
UCT (its=1365)
592
78
165
835
0.7254 <= 0.7557 <= 0.7836
43.35
9.34
47.31
25.00
29
UCT (its=3710)
265
36
65
366
0.7276 <= 0.7732 <= 0.8132
46.45
9.84
43.72
25.00
30
UCT (its=3710)
453
114
433
1000
0.4790 <= 0.5100 <= 0.5409
38.80
11.40
49.80
25.00
Search for levels ended: time limit reached.
Level of Play: Strong beats Weak 60% of the time (lower bound with 95% confidence).
Draw%, p1 win% and game length may give some indication of trends as AI strength increases.
1st Player Win Ratios by Playing Strength
This chart shows the win(green)/draw(black)/loss(red) percentages, as UCT play strength increases. Note that for most games, the top playing strength show here will be distinctly below human standard.
Complexity
Game length
25.00
Branching factor
21.90
Complexity
10^30.71
Based on game length and branching factor
Samples
1000
Quantity of logged games played
Move Classification
Board Size
25
Quantity of distinct board cells
Distinct actions
50
Quantity of distinct moves (e.g. "e4") regardless of position in game tree
Good moves
21
A good move is selected by the AI more than the average
Bad moves
29
A bad move is selected by the AI less than the average
Response distance%
38.12%
Distance from move to response / maximum board distance; a low value suggests a game is tactical rather than strategic.
Samples
1000
Quantity of logged games played
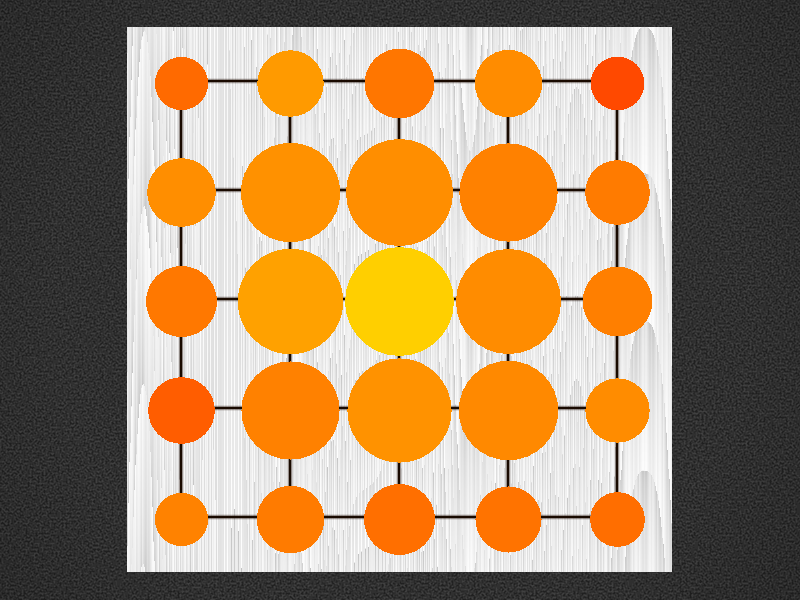
Board Coverage
A mean of 88.86% of board locations were used per game.
Colour and size show the frequency of visits.
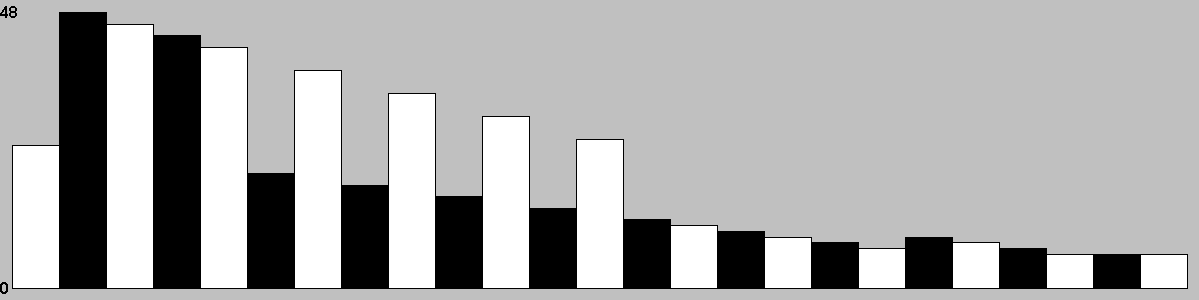
Game Length
Game length frequencies.
Mean
25.00
Mode
[25]
Median
25.0
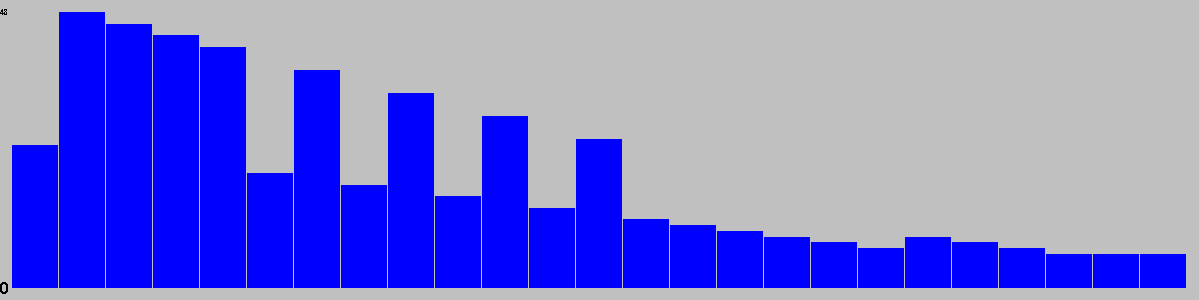
Change in Material Per Turn
Mean change in material/round
0.54
Complete round of play (all players)
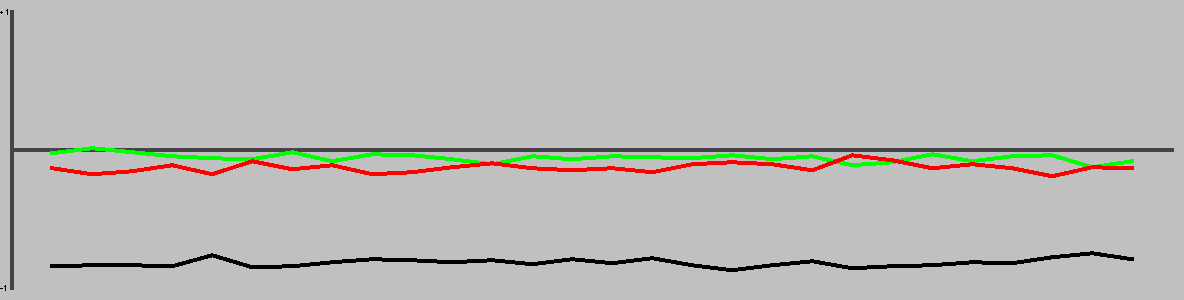
This chart is based on a single representative* playout, and gives a feel for the change in material over the course of a game. (* Representative in the sense that it is close to the mean length.)
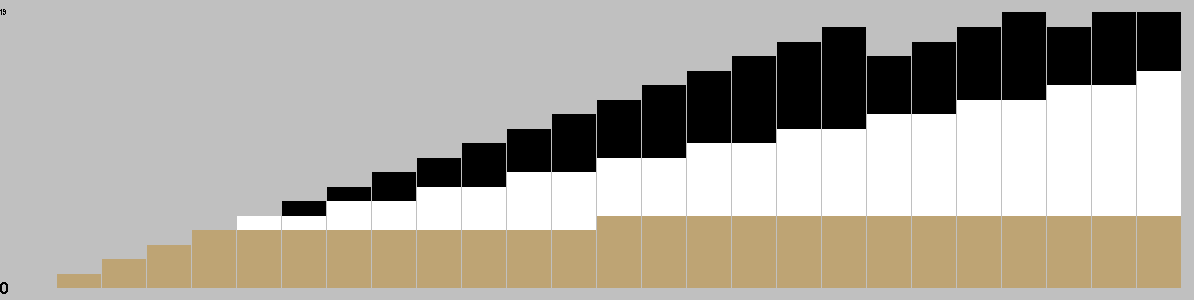
Actions/turn
Table: branching factor per turn, based on a single representative* game. (* Representative in the sense that it is close to the mean game length.)
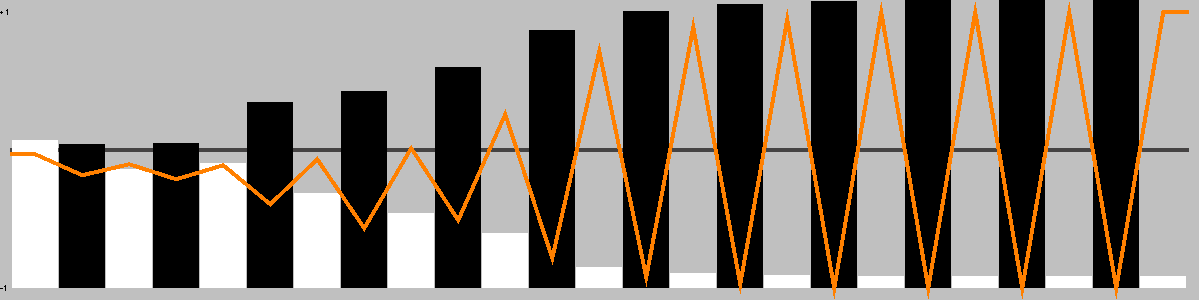
Action Types per Turn
This chart is based on a single representative* game, and gives a feel for the types of moves available throughout that game. (* Representative in the sense that it is close to the mean game length.)
This chart shows the best move value with respect to the active player; the orange line represents the value of doing nothing (null move).
The lead changed on 16% of the game turns. Ai Ai found 1 critical turn (turns with only one good option).
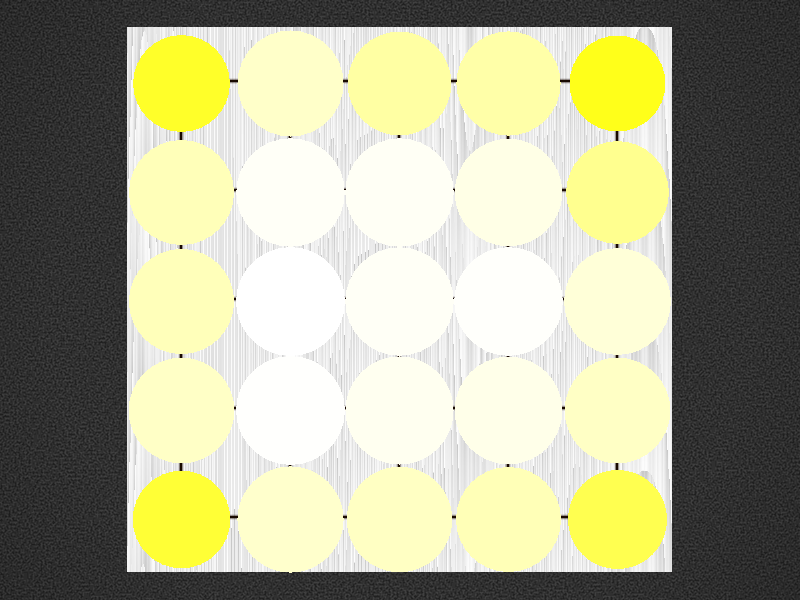
Position Heatmap
This chart shows the relative temperature of all moves each turn. Colour range: black (worst), red, orange(even), yellow, white(best).
Good/Effective moves
Measure
All players
Player 1
Player 2
Mean % of effective moves
59.71
53.20
66.76
Mean no. of effective moves
6.64
5.77
7.58
Effective game space
10^17.74
10^7.56
10^10.18
Mean % of good moves
35.67
68.42
0.19
Mean no. of good moves
5.60
10.69
0.08
Good move game space
10^12.10
10^12.10
10^0.00
These figures were calculated over a single game.
An effective move is one with score 0.1 of the best move (including the best move). -1 (loss) <= score <= 1 (win)
A good move has a score > 0. Note that when there are no good moves, an multiplier of 1 is used for the game space calculation.
Quality Measures
Measure
Value
Description
Hot turns
60.00%
A hot turn is one where making a move is better than doing nothing.
Momentum
32.00%
% of turns where a player improved their score.
Correction
8.00%
% of turns where the score headed back towards equality.
Depth
2.93%
Difference in evaluation between a short and long search.
Drama
0.00%
How much the winner was behind before their final victory.
Foulup Factor
20.00%
Moves that looked better than the best move after a short search.
Surprising turns
0.00%
Turns that looked bad after a short search, but good after a long one.
Last lead change
20.00%
Distance through game when the lead changed for the last time.
Decisiveness
28.00%
Distance from the result being known to the end of the game.
These figures were calculated over a single representative* game, and based on the measures of quality described in "Automatic Generation and Evaluation of Recombination Games" (Cameron Browne, 2007). (* Representative, in the sense that it is close to the mean game length.)
Opening Heatmap
Colour shows the success ratio of this play over the first 10moves; black < red < yellow < white.
Size shows the frequency this move is played.
Positions Reachable at Depth (Includes Transpositions)
0
1
2
3
4
1
25
1225
56425
2485257
Note: most games do not take board rotation and reflection into consideration. Multi-part turns could be treated as the same or different depth depending on the implementation. Counts to depth N include all moves reachable at lower depths. Zobrist hashes are not available for this game, so transpositions are included in the counts.
Shortest Game(s)
No solutions found to depth 4.
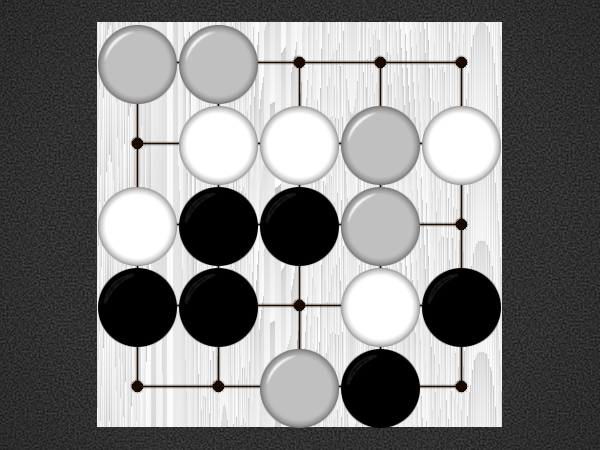
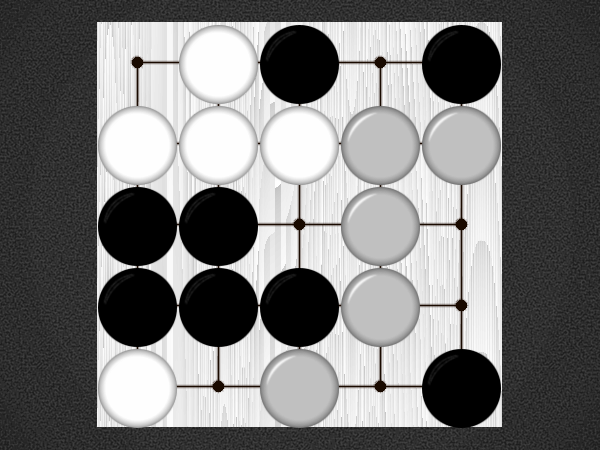
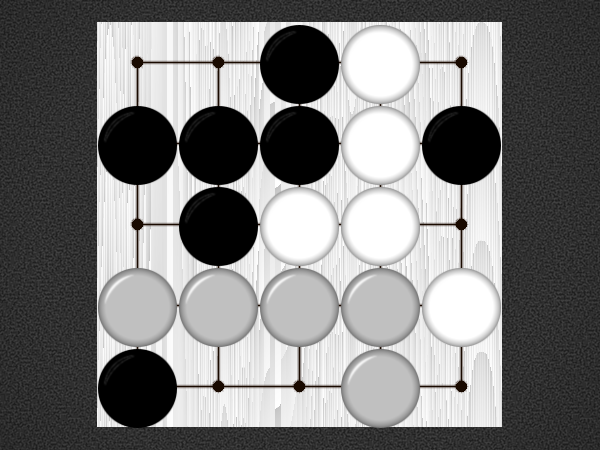
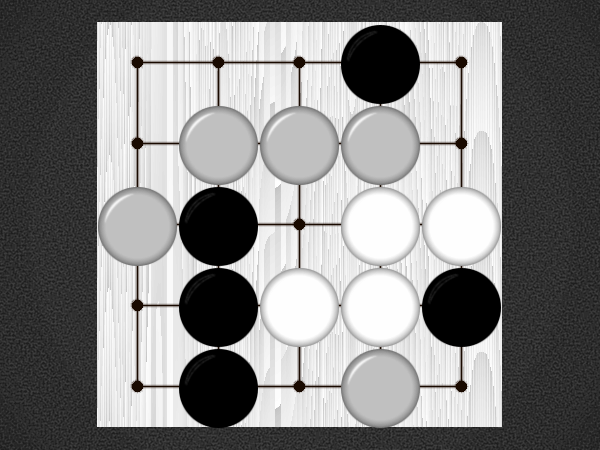
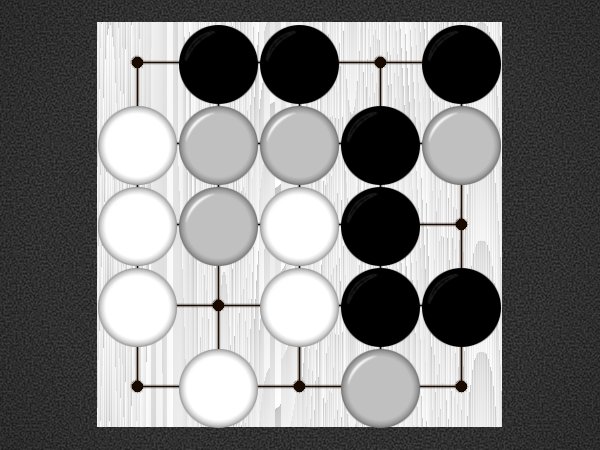
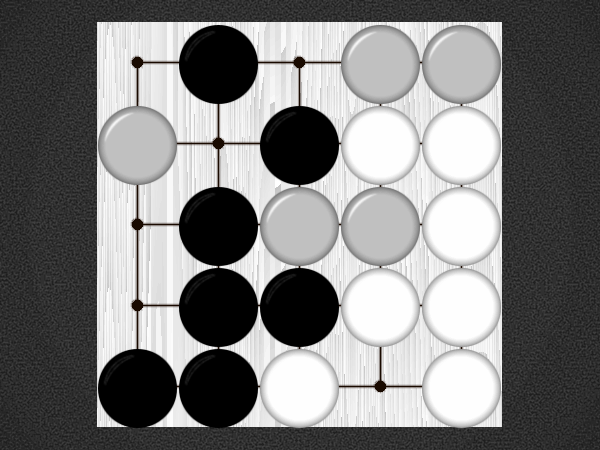
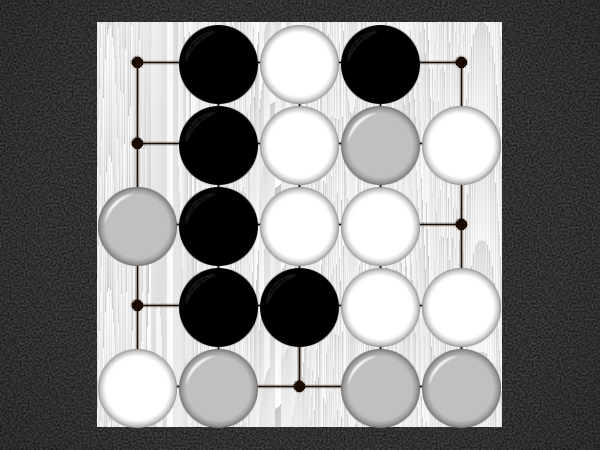
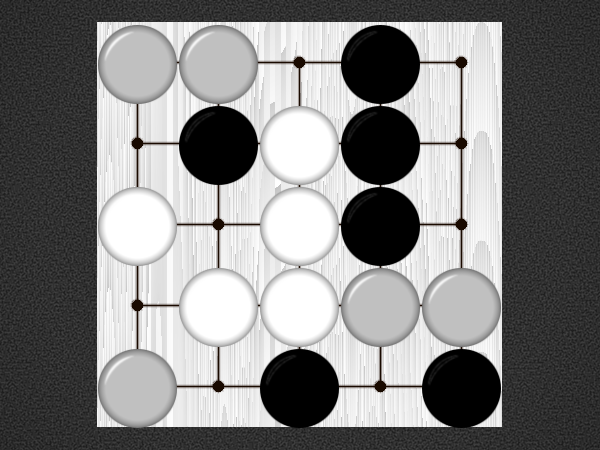
Puzzles
Puzzle
Solution
White to win in 7 moves
White to win in 3 moves
White to win in 5 moves
White to win in 5 moves
White to win in 7 moves
White to win in 9 moves
White to win in 3 moves
Black to win in 2 moves
White to win in 3 moves
White to win in 3 moves
White to win in 9 moves
Weak puzzle selection criteria are in place; the first move may not be unique.