An extremely interesting riff on Go. The flip-captures mean there's no need for a ko rule, and the growth rules lead to a shorter game than go on a similar sized board. Interesting trade-offs between growing and seeding; as you'd expect from the Symple mechanism. I think I prefer this to Symple; Sygo feels sharper, in the sense that each stone placement is more critical. In Symple, where you grow seems much less important than the simple fact that you are growing; but that may just be my flawed understanding of the game.
T0afer
7
Although Sygo is great, I honestly am not sure I like it as much as I first did. In general I view Go variants as less interesting than chess variants because with chess variants they add needed variety or fix (or attempt to fix) several issues with high level chess play or perceived lack of material completeness. With Go it feels like Go doesn't lack that sort of variety or suffer from First Player Advantage or Draw margin enough to warrant spending much time with the various variants. Because of that I'm bumping Sygo down while simultaneously bumping up my admiration of Symple. I just enjoy the elegance and simplicity of Symple more.
milomilo122
N/A
When I first learned about the concept behind this game, I was dubious - it seemed like a recipe for chaos, what with the possibility for placing a large number of stones on a single turn. I've since learned that many people react similarly to the idea. However, when I played the game my doubts dissolved. It works waaaaaaay better than the rules suggest it would. In fact it's a very good game, maybe even a great one. Update: after a few further attempts to play this game, having to place all those stones on a single turn has gotten a little frustrating for me. Analysis overload.
orangeblood
7
Another fun design from Christian, and another one that he calls among his most important… among his six core games (the others being Grand Chess, Dameo, Emergo, Symple, and Storisende). Of course it will inevitably be compared to Symple (because it uses the same move protocol). However, once you get into your first game, you’ll see it’s not really like Symple at all. Once the game is finished, the scoring is pretty much like Go. But to get there… really wild. When you capture stones they’re flipped, Othello-like, to your own color. This can present problems as you of course are trying to form two eyes in each of your groups. It’s also really fun to think about things like what would be a normal joseki in Go. Should I try a 3-3 invasion? Maybe not, given that you don’t always connect to the whole group, and thus would lose a turn adding to each of your other groups. Anyway, I can’t really say if I prefer Symple or Sygo at this point, but I do like them both very much!
Kolomogorov Complexity Analysis
Size (bytes)
38461
Reference Size
10293
Ratio
3.74
Ai Ai calculates the size of the implementation, and compares it to the Ai Ai implementation of the simplest possible game (which just fills the board). Note that this estimate may include some graphics and heuristics code as well as the game logic. See the wikipedia entry for more details.
Playout Complexity Estimate
Playouts per second
1218.04 (820.99µs/playout)
Reference Size
2052123.95 (0.49µs/playout)
Ratio (low is good)
1684.78
Tavener complexity: the heat generated by playing every possible instance of a game with a perfectly efficient programme. Since this is not possible to calculate, Ai Ai calculates the number of random playouts per second and compares it to the fastest non-trivial Ai Ai game (Connect 4). This ratio gives a practical indication of how complex the game is. Combine this with the computational state space, and you can get an idea of how strong the default (MCTS-based) AI will be.
Playout/Search Speed
Label
Its/s
SD
Nodes/s
SD
Game length
SD
Random playout
1,189
49
343,716
14,130
289
10
search.UCB
1,229
12
283
30
search.UCT
1,224
11
285
11
Random: 10 second warmup for the hotspot compiler. 100 trials of 1000ms each.
Other: 100 playouts, means calculated over the first 5 moves only to avoid distortion due to speedup at end of game.
Mirroring Strategies
Rotation (Half turn) lost each game as expected.
Reflection (X axis) lost each game as expected.
Reflection (Y axis) lost each game as expected.
Copy last move lost each game as expected.
Mirroring strategies attempt to copy the previous move. On first move, they will attempt to play in the centre. If neither of these are possible, they will pick a random move. Each entry represents a different form of copying; direct copy, reflection in either the X or Y axis, half-turn rotation.
Win % By Player (Bias)
1: White win %
50.90±3.10
Includes draws = 50%
2: Black win %
49.10±3.09
Includes draws = 50%
Draw %
0.60
Percentage of games where all players draw.
Decisive %
99.40
Percentage of games with a single winner.
Samples
1000
Quantity of logged games played
Note: that win/loss statistics may vary depending on thinking time (horizon effect, etc.), bad heuristics, bugs, and other factors, so should be taken with a pinch of salt. (Given perfect play, any game of pure skill will always end in the same result.)
Note: Ai Ai differentiates between states where all players draw or win or lose; this is mostly to support cooperative games.
UCT Skill Chains
Match
AI
Strong Wins
Draws
Strong Losses
#Games
Strong Score
p1 Win%
Draw%
p2 Win%
Game Length
0
Random
1
UCT (its=2)
630
2
303
935
0.6442 <= 0.6749 <= 0.7041
51.55
0.21
48.24
288.47
4
UCT (its=5)
630
1
355
986
0.6090 <= 0.6395 <= 0.6688
50.10
0.10
49.80
288.27
7
UCT (its=8)
565
2
433
1000
0.5351 <= 0.5660 <= 0.5964
48.10
0.20
51.70
287.10
8
UCT (its=8)
481
2
517
1000
0.4512 <= 0.4820 <= 0.5130
46.90
0.20
52.90
288.55
Search for levels ended: time limit reached.
Level of Play: Strong beats Weak 60% of the time (lower bound with 95% confidence).
Draw%, p1 win% and game length may give some indication of trends as AI strength increases.
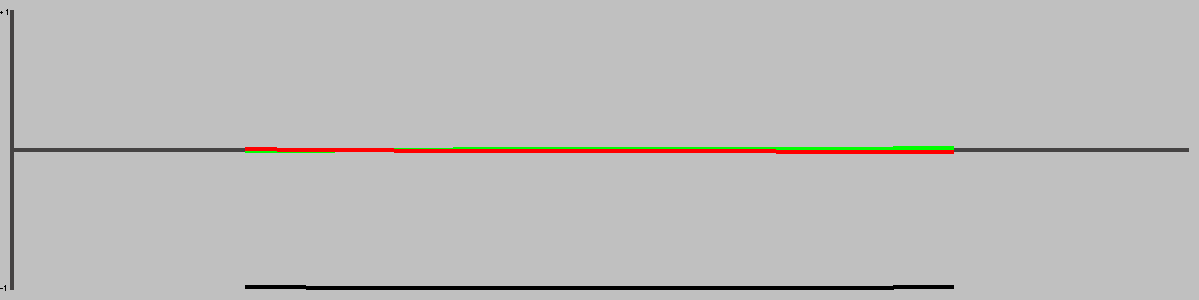
1st Player Win Ratios by Playing Strength
This chart shows the win(green)/draw(black)/loss(red) percentages, as UCT play strength increases. Note that for most games, the top playing strength show here will be distinctly below human standard.
Complexity
Game length
274.16
Branching factor
66.83
Complexity
10^412.30
Based on game length and branching factor
Computational Complexity
10^8.27
Sample quality (100 best): 1.43
Samples
1000
Quantity of logged games played
Computational complexity (where present) is an estimate of the game tree reachable through actual play. For each game in turn, Ai Ai marks the positions reached in a hashtable, then counts the number of new moves added to the table. Once all moves are applied, it treats this sequence as a geometric progression and calculates the sum as n-> infinity.
Move Classification
Distinct actions
273
Number of distinct moves (e.g. "e4") regardless of position in game tree
Good moves
204
A good move is selected by the AI more than the average
Bad moves
69
A bad move is selected by the AI less than the average
Response distance
9.09
Mean distance between move and response; a low value relative to the board size may mean a game is tactical rather than strategic.
Samples
1000
Quantity of logged games played
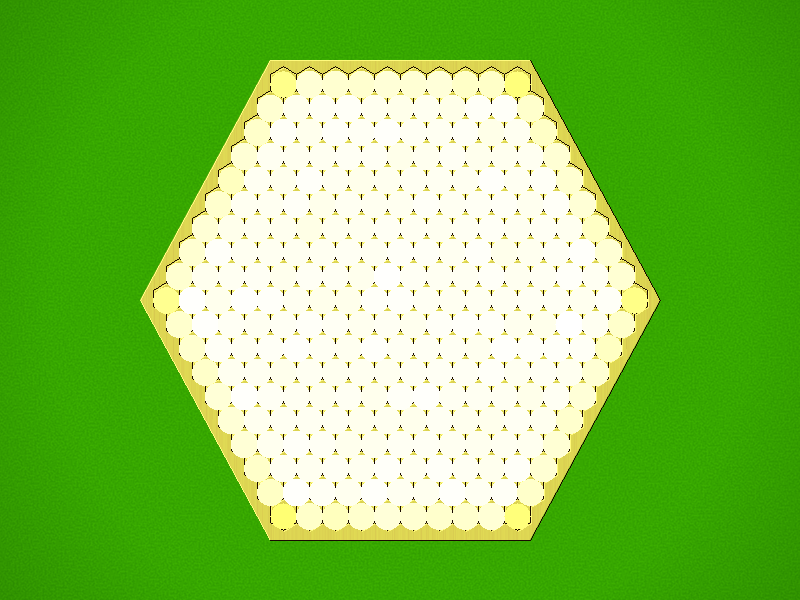
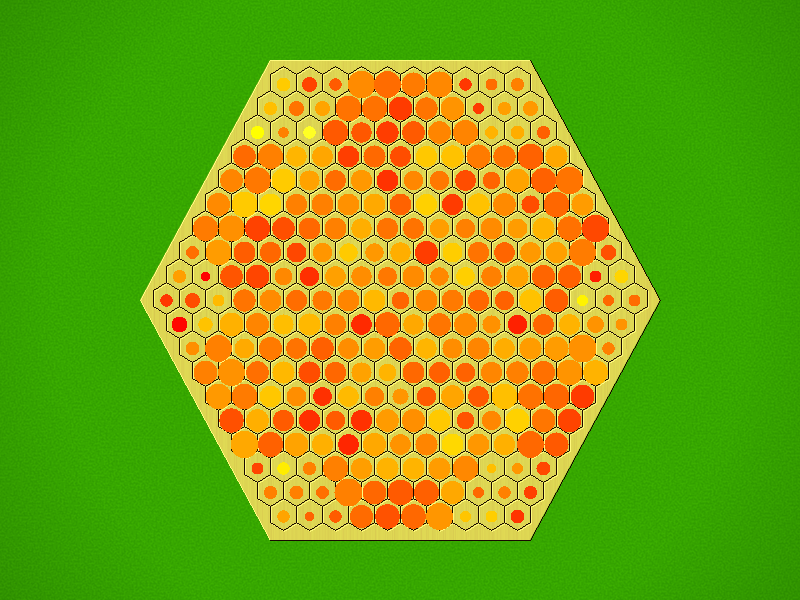
Board Coverage
A mean of 94.79% of board locations were used per game.
Colour and size show the frequency of visits.
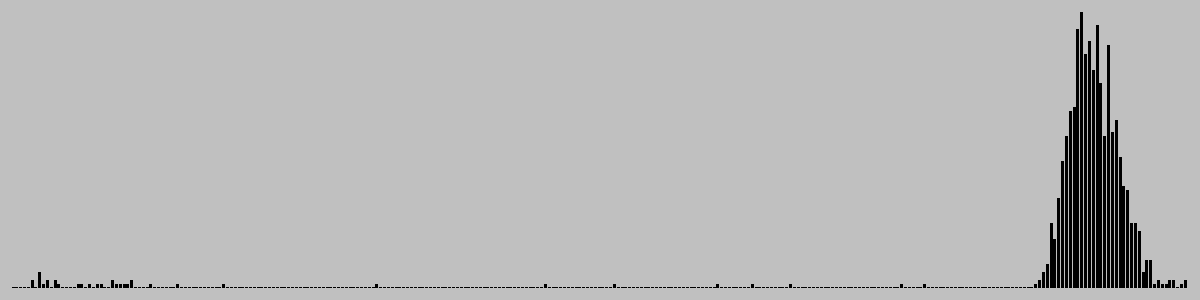
Game Length
Game length frequencies.
Mean
274.16
Mode
[279]
Median
281.0
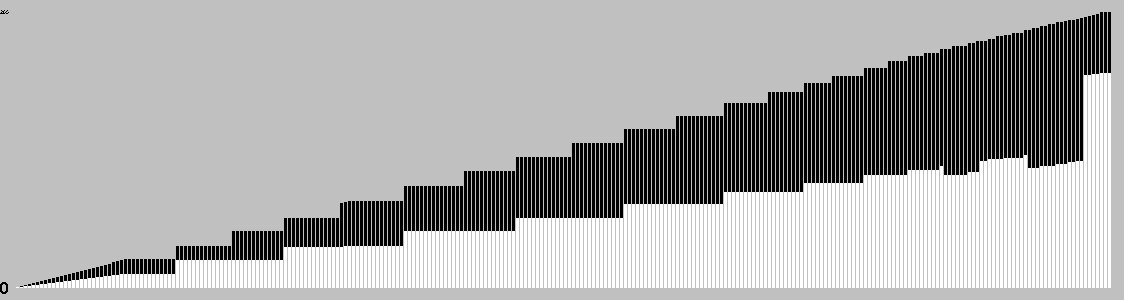
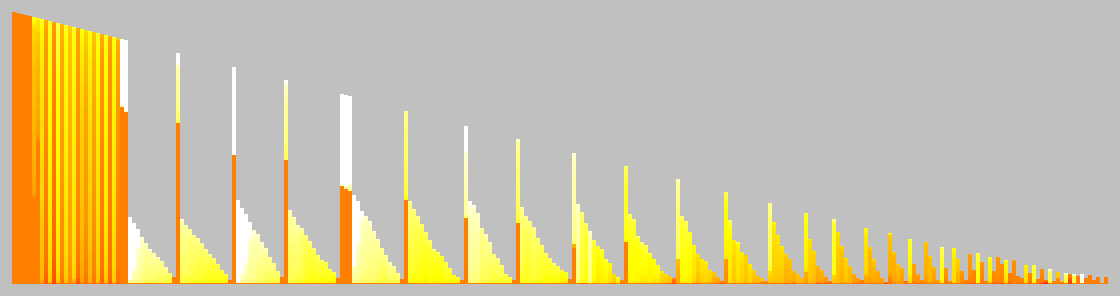
Change in Material Per Turn
This chart is based on a single representative* playout, and gives a feel for the change in material over the course of a game. (* Representative in the sense that it is close to the mean length.)
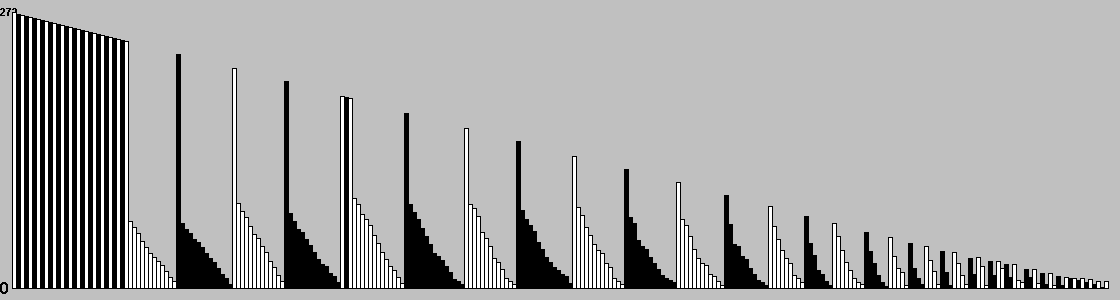
Actions/turn
Table: branching factor per turn, based on a single representative* game. (* Representative in the sense that it is close to the mean game length.)
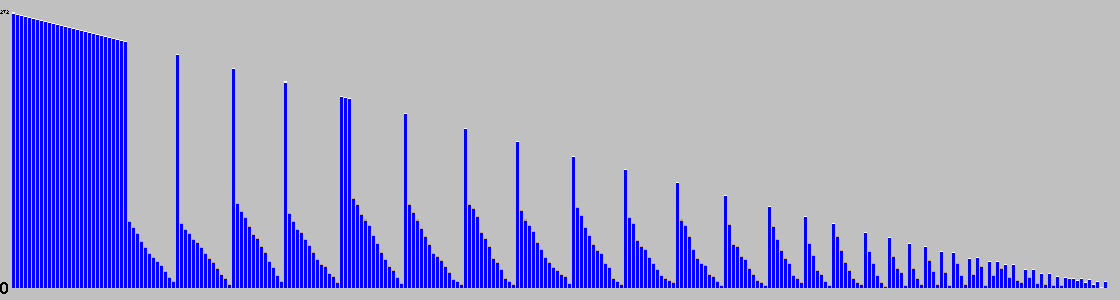
Action Types per Turn
This chart is based on a single representative* game, and gives a feel for the types of moves available throughout that game. (* Representative in the sense that it is close to the mean game length.)
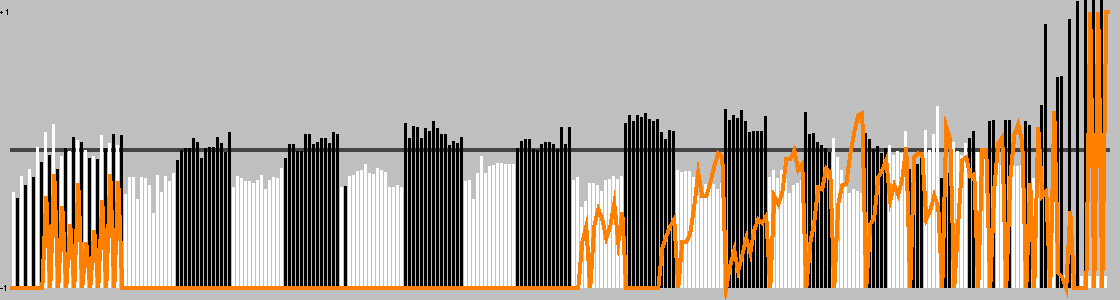
This chart shows the best move value with respect to the active player; the orange line represents the value of doing nothing (null move).
The lead changed on 16% of the game turns. Ai Ai found 6 critical turns (turns with only one good option).
Position Heatmap
This chart shows the relative temperature of all moves each turn. Colour range: black (worst), red, orange(even), yellow, white(best).
Good/Effective moves
Measure
All players
Player 1
Player 2
Mean % of effective moves
71.86
73.06
70.58
Mean no. of effective moves
31.05
32.49
29.53
Effective game space
10^335.21
10^174.66
10^160.56
Mean % of good moves
62.70
75.40
49.23
Mean no. of good moves
27.16
30.67
23.44
Good move game space
10^307.18
10^173.04
10^134.14
These figures were calculated over a single game.
An effective move is one with score 0.1 of the best move (including the best move). -1 (loss) <= score <= 1 (win)
A good move has a score > 0. Note that when there are no good moves, an multiplier of 1 is used for the game space calculation.
Quality Measures
Measure
Value
Description
Hot turns
96.72%
A hot turn is one where making a move is better than doing nothing.
Momentum
29.93%
% of turns where a player improved their score.
Correction
49.64%
% of turns where the score headed back towards equality.
Depth
10.86%
Difference in evaluation between a short and long search.
Drama
0.21%
How much the winner was behind before their final victory.
Foulup Factor
81.75%
Moves that looked better than the best move after a short search.
Surprising turns
2.19%
Turns that looked bad after a short search, but good after a long one.
Last lead change
87.23%
Distance through game when the lead changed for the last time.
Decisiveness
3.28%
Distance from the result being known to the end of the game.
These figures were calculated over a single representative* game, and based on the measures of quality described in "Automatic Generation and Evaluation of Recombination Games" (Cameron Browne, 2007). (* Representative, in the sense that it is close to the mean game length.)
Opening Heatmap
Colour shows the success ratio of this play over the first 10moves; black < red < yellow < white.
Size shows the frequency this move is played.
Unique Positions Reachable at Depth
0
1
2
1
271
73441
Note: most games do not take board rotation and reflection into consideration. Multi-part turns could be treated as the same or different depth depending on the implementation. Counts to depth N include all moves reachable at lower depths. Inaccuracies may also exist due to hash collisions, but Ai Ai uses 64-bit hashes so these will be a very small fraction of a percentage point.
Shortest Game(s)
No solutions found to depth 2.
Puzzles
Puzzle
Solution
White to win in 12 moves
White to win in 8 moves
Weak puzzle selection criteria are in place; the first move may not be unique.