Full Report for Icebreaker by Mark Steere

Full Report for Icebreaker by Mark Steere

A two player game played on a hexagonal grid.

Generated at 08/02/2022, 20:01 from 1000 logged games.

Rules

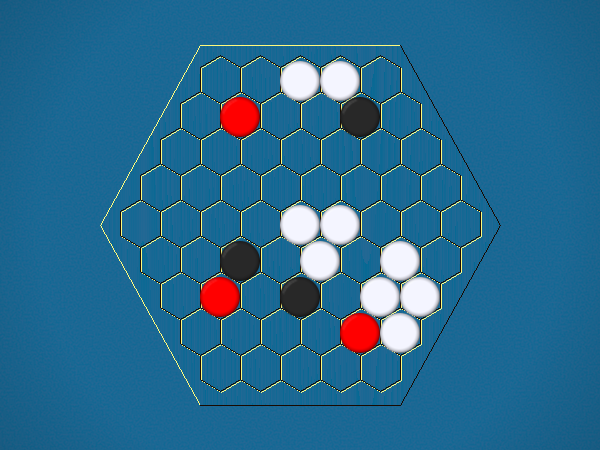
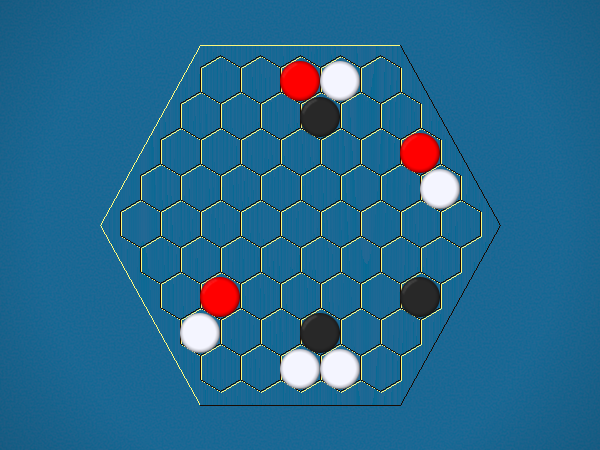
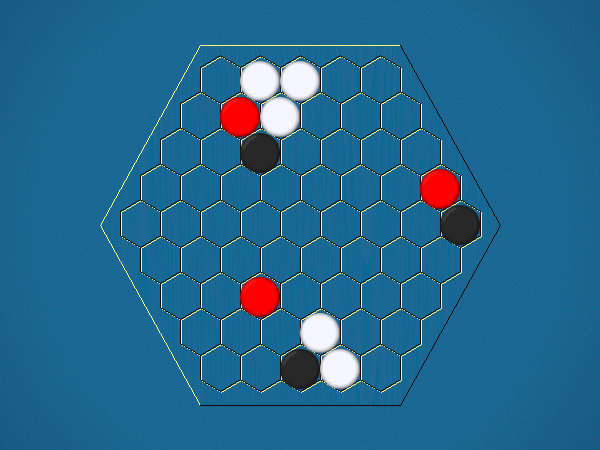
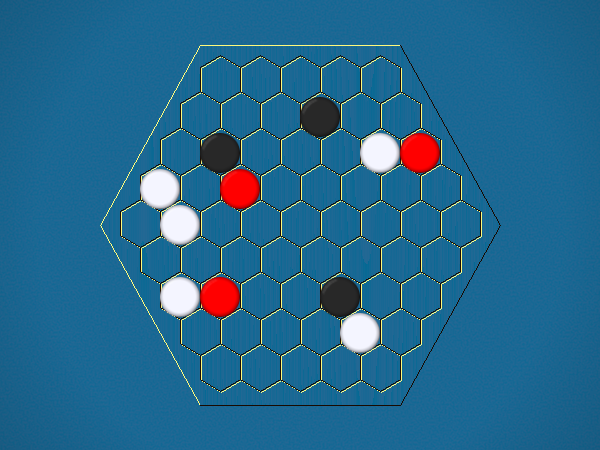
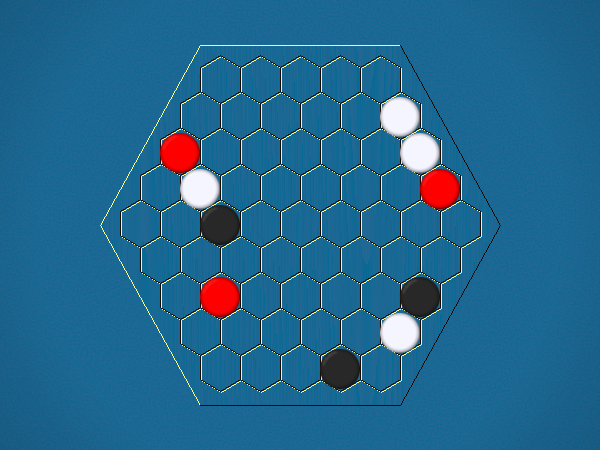
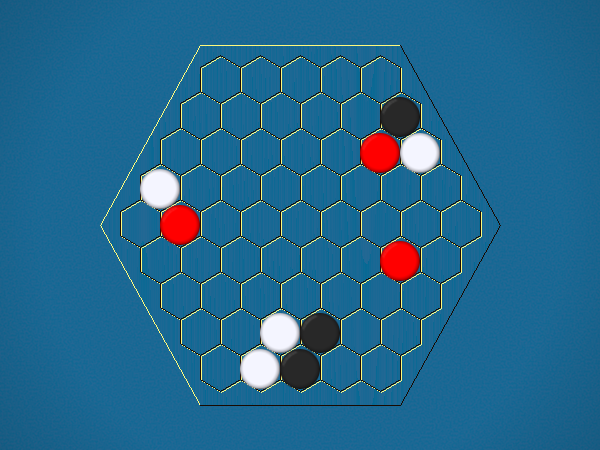
Representative game (in the sense of being of mean length). Wherever you see the 'representative game' referred to in later sections, this is it!

Full rules, including illustrations, are available at Mark Steere Games.
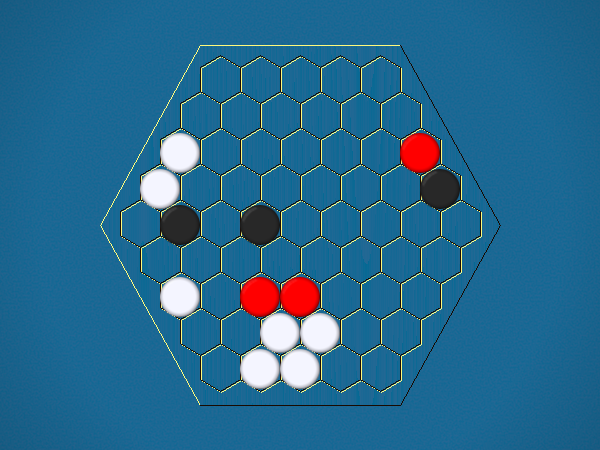
MOVES

You must move one of your ships to an adjacent cell which doesn't contain another ship. By moving to a cell containing an iceberg, you capture the iceberg, and your score increases by 1.

MOVE DIRECTION

You must select one of your ships to move, and move it closer to its closest iceberg. Distance is measured by the number of cells between ship and iceberg along the shortest path of cells that connects them, going around other ships. If the ship you've chosen to move has icebergs adjacent to it, you must capture one of them.>/p>

OBJECT OF THE GAME

The goal is to capture the majority of the icebergs. On a size 5 board, there are 55 icebergs starting out. If you capture 28 of them, youwin.

Miscellaneous

General comments:

Play: Combinatorial

Mechanism(s): Capture,Scoring

BGG Stats

BGG EntryIcebreaker
BGG Rating5
#Voters1
SD0
BGG Weight0
#Voters0
Year2021

BGG Ratings and Comments

UserRatingComment
OhmSweetOhm5

Kolomogorov Complexity Analysis

Size (bytes)27404
Reference Size10673
Ratio2.57

Ai Ai calculates the size of the implementation, and compares it to the Ai Ai implementation of the simplest possible game (which just fills the board). Note that this estimate may include some graphics and heuristics code as well as the game logic. See the wikipedia entry for more details.

Playout Complexity Estimate

Playouts per second36648.16 (27.29µs/playout)
Reference Size509839.91 (1.96µs/playout)
Ratio (low is good)13.91

Tavener complexity: the heat generated by playing every possible instance of a game with a perfectly efficient programme. Since this is not possible to calculate, Ai Ai calculates the number of random playouts per second and compares it to the fastest non-trivial Ai Ai game (Connect 4). This ratio gives a practical indication of how complex the game is. Combine this with the computational state space, and you can get an idea of how strong the default (MCTS-based) AI will be.

State Space Complexity

% new positions/bucket

State Space Complexity62564205 
State Space Complexity (log 10)7.80 
Samples1029612 
Confidence99.930: totally unreliable, 100: perfect

State space complexity (where present) is an estimate of the number of distinct game tree reachable through actual play. Over a series of random games, Ai Ai checks each position to see if it is new, or a repeat of a previous position and keeps a total for each game. As the number of games increase, the quantity of new positions seen per game decreases. These games are then partitioned into a number of buckets, and if certain conditions are met, Ai Ai treats the number in each bucket as the start of a strictly decreasing geometric sequence and sums it to estimate the total state space. The accuracy is calculated as 1-[end bucket count]/[starting bucklet count]

Playout/Search Speed

LabelIts/sSDNodes/sSDGame lengthSD
Random playout41,2431,2642,789,39785,563687
search.UCT42,2081,650613

Random: 10 second warmup for the hotspot compiler. 100 trials of 1000ms each.

Other: 100 playouts, means calculated over the first 5 moves only to avoid distortion due to speedup at end of game.

Mirroring Strategies

Rotation (Half turn) lost each game as expected.
Reflection (X axis) lost each game as expected.
Reflection (Y axis) lost each game as expected.
Copy last move lost each game as expected.

Mirroring strategies attempt to copy the previous move. On first move, they will attempt to play in the centre. If neither of these are possible, they will pick a random move. Each entry represents a different form of copying; direct copy, reflection in either the X or Y axis, half-turn rotation.

Win % By Player (Bias)

1: Red win %56.50±3.09Includes draws = 50%
2: Black win %43.50±3.04Includes draws = 50%
Draw %0.00Percentage of games where all players draw.
Decisive %100.00Percentage of games with a single winner.
Samples1000Quantity of logged games played

Note: that win/loss statistics may vary depending on thinking time (horizon effect, etc.), bad heuristics, bugs, and other factors, so should be taken with a pinch of salt. (Given perfect play, any game of pure skill will always end in the same result.)

Note: Ai Ai differentiates between states where all players draw or win or lose; this is mostly to support cooperative games.

UCT Skill Chains

MatchAIStrong WinsDrawsStrong Losses#GamesStrong Scorep1 Win%Draw%p2 Win%Game Length
0Random         
1UCT (its=2)63103529830.6114 <= 0.6419 <= 0.671355.040.0044.9667.10
3UCT (its=4)63103389690.6206 <= 0.6512 <= 0.680556.350.0043.6566.75
6UCT (its=7)63103519820.6121 <= 0.6426 <= 0.671954.380.0045.6267.16
9UCT (its=24)63101257560.8065 <= 0.8347 <= 0.859451.460.0048.5465.09
10UCT (its=67)63101818120.7472 <= 0.7771 <= 0.804455.790.0044.2163.85
11UCT (its=181)63101928230.7366 <= 0.7667 <= 0.794354.310.0045.6963.01
12UCT (its=491)63101818120.7472 <= 0.7771 <= 0.804454.800.0045.2062.06
13UCT (its=1336)63101818120.7472 <= 0.7771 <= 0.804456.280.0043.7261.29
14UCT (its=3631)63102418720.6930 <= 0.7236 <= 0.752354.700.0045.3061.10
15
UCT (its=3631)
500
0
500
1000
0.4691 <= 0.5000 <= 0.5309
56.00
0.00
44.00
61.13

Search for levels ended: time limit reached.

Level of Play: Strong beats Weak 60% of the time (lower bound with 95% confidence).

Draw%, p1 win% and game length may give some indication of trends as AI strength increases.

1st Player Win Ratios by Playing Strength

This chart shows the win(green)/draw(black)/loss(red) percentages, as UCT play strength increases. Note that for most games, the top playing strength show here will be distinctly below human standard.

Complexity

Game length60.63 
Branching factor7.39 
Complexity10^50.56Based on game length and branching factor
Computational Complexity10^7.24Sample quality (100 best): 0.94
Samples1000Quantity of logged games played

Computational complexity (where present) is an estimate of the game tree reachable through actual play. For each game in turn, Ai Ai marks the positions reached in a hashtable, then counts the number of new moves added to the table. Once all moves are applied, it treats this sequence as a geometric progression and calculates the sum as n-> infinity.

Move Classification

Board Size61Quantity of distinct board cells
Distinct actions311Quantity of distinct moves (e.g. "e4") regardless of position in game tree
Killer moves1A 'killer' move is selected by the AI more than 50% of the time
Killers: h5-i5
Good moves178A good move is selected by the AI more than the average
Bad moves133A bad move is selected by the AI less than the average
Terrible moves3A terrible move is never selected by the AI
Terrible moves: b5-a5,h2-i1,e8-e9
Response distance%42.25%Distance from move to response / maximum board distance; a low value suggests a game is tactical rather than strategic.
Samples1000Quantity of logged games played

Board Coverage

A mean of 96.26% of board locations were used per game.

Colour and size show the frequency of visits.

Game Length

Game length frequencies.

Mean60.63
Mode[59]
Median60.0

Change in Material Per Turn

Mean change in material/round0.00Complete round of play (all players)

This chart is based on a single representative* playout, and gives a feel for the change in material over the course of a game. (* Representative in the sense that it is close to the mean length.)

Actions/turn

Table: branching factor per turn, based on a single representative* game. (* Representative in the sense that it is close to the mean game length.)

Action Types per Turn

This chart is based on a single representative* game, and gives a feel for the types of moves available throughout that game. (* Representative in the sense that it is close to the mean game length.)

Red: removal, Black: move, Blue: Add, Grey: pass, Purple: swap sides, Brown: other.

Trajectory

This chart shows the best move value with respect to the active player; the orange line represents the value of doing nothing (null move).

The lead changed on 6% of the game turns. Ai Ai found 7 critical turns (turns with only one good option).

Position Heatmap

This chart shows the relative temperature of all moves each turn. Colour range: black (worst), red, orange(even), yellow, white(best).

Good/Effective moves

MeasureAll playersPlayer 1Player 2
Mean % of effective moves50.7236.8665.04
Mean no. of effective moves3.592.774.43
Effective game space10^29.0410^11.1610^17.88
Mean % of good moves25.1643.496.22
Mean no. of good moves1.743.030.40
Good move game space10^13.3610^12.1010^1.26

These figures were calculated over a single game.

An effective move is one with score 0.1 of the best move (including the best move). -1 (loss) <= score <= 1 (win)

A good move has a score > 0. Note that when there are no good moves, an multiplier of 1 is used for the game space calculation.

Quality Measures

MeasureValueDescription
Hot turns78.69%A hot turn is one where making a move is better than doing nothing.
Momentum18.03%% of turns where a player improved their score.
Correction40.98%% of turns where the score headed back towards equality.
Depth6.34%Difference in evaluation between a short and long search.
Drama0.11%How much the winner was behind before their final victory.
Foulup Factor22.95%Moves that looked better than the best move after a short search.
Surprising turns6.56%Turns that looked bad after a short search, but good after a long one.
Last lead change60.66%Distance through game when the lead changed for the last time.
Decisiveness22.95%Distance from the result being known to the end of the game.

These figures were calculated over a single representative* game, and based on the measures of quality described in "Automatic Generation and Evaluation of Recombination Games" (Cameron Browne, 2007). (* Representative, in the sense that it is close to the mean game length.)

Openings

MovesAnimation
e1-f1,i1-i2,f1-g1,e9-e8,g1-h1,i2-h2,h1-g2
e1-f1,e9-e8,f1-g1,i1-i2,g1-h1,i2-h2,h1-g2
e1-d2,i1-i2,i5-i4,e9-d9,i4-i3,d9-c9,a9-b8
e1-d2,e9-d9,i5-i4,i1-i2,i4-i3,d9-c9,a9-b8
e1-e2,i1-h1,e2-f1,a5-a6,f1-g1,h1-g2,g1-f2
e1-e2,a5-a6,e2-f1,i1-h1,f1-g1,h1-g2,g1-f2
i5-i4,i1-i2,e1-d2,e9-d9,i4-i3,d9-c9,a9-b8
i5-i4,e9-d9,e1-d2,i1-i2,i4-i3,d9-c9,a9-b8
e1-e2,i1-h2,i5-i4,e9-e8,a9-a8,h2-h3
e1-e2,e9-e8,i5-i4,i1-h2,a9-a8,h2-h3
i5-i4,i1-h2,e1-e2,e9-e8,a9-a8,h2-h3
i5-i4,e9-e8,e1-e2,i1-h2,a9-a8,h2-h3

Opening Heatmap

Colour shows the success ratio of this play over the first 10moves; black < red < yellow < white.

Size shows the frequency this move is played.

Unique Positions Reachable at Depth

0123456789
1990630422424942143580762696396213719478540

Note: most games do not take board rotation and reflection into consideration.
Multi-part turns could be treated as the same or different depth depending on the implementation.
Counts to depth N include all moves reachable at lower depths.
Inaccuracies may also exist due to hash collisions, but Ai Ai uses 64-bit hashes so these will be a very small fraction of a percentage point.

Shortest Game(s)

No solutions found to depth 9.

Puzzles

PuzzleSolution

Red to win in 13 moves

Red to win in 11 moves

Black to win in 11 moves

Black to win in 9 moves

Red to win in 11 moves

Black to win in 5 moves

Red to win in 5 moves

Red to win in 9 moves

Black to win in 7 moves

Red to win in 5 moves

Black to win in 3 moves

Red to win in 3 moves

Selection criteria: first move must be unique, and not forced to avoid losing. Beyond that, Puzzles will be rated by the product of [total move]/[best moves] at each step, and the best puzzles selected.