Full Report for Implo by Luis Bolaños Mures

Full Report for Implo by Luis Bolaños Mures

Claim empty regions by owning the largest group adjacent to them.

Generated at 15/03/2021, 19:22 from 1000 logged games.

Rules

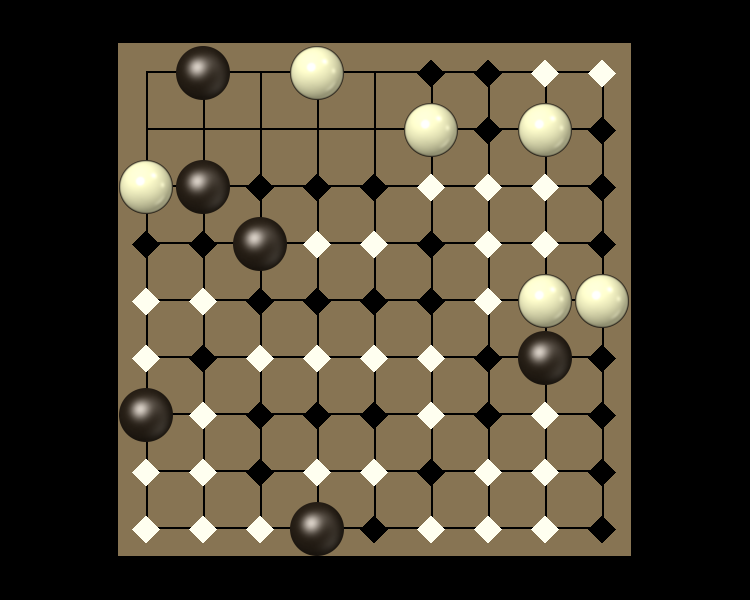
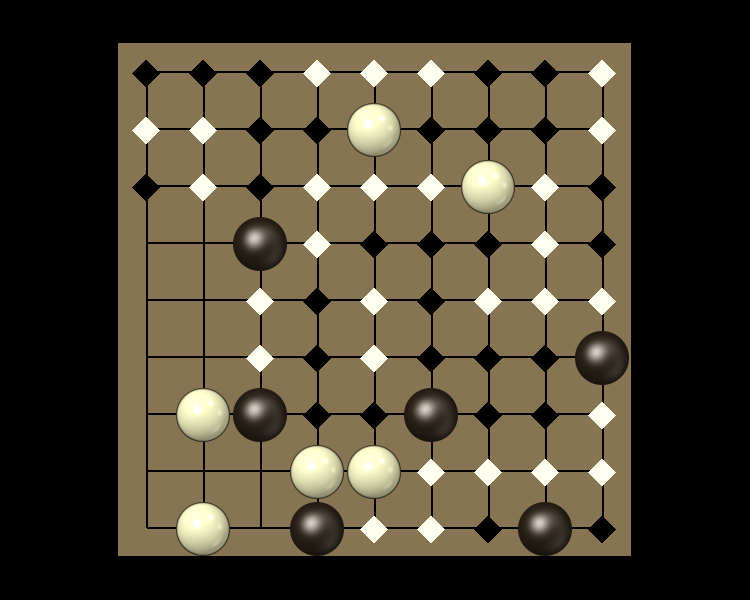
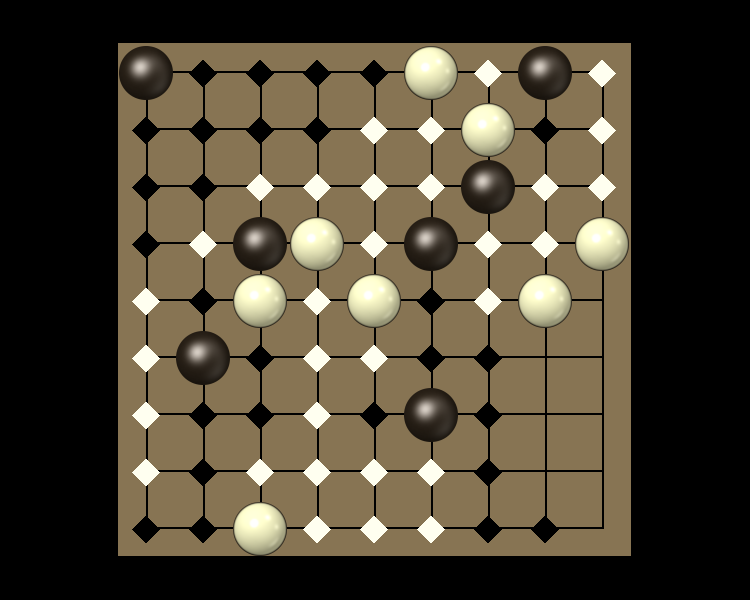
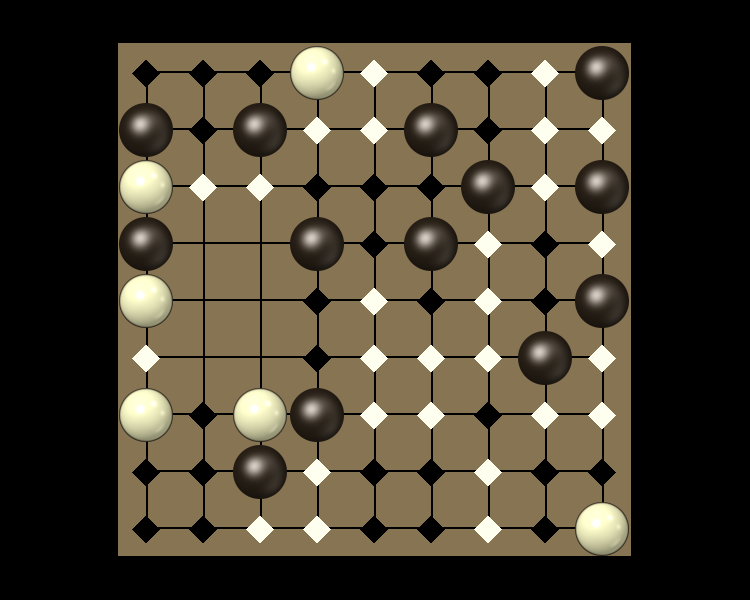
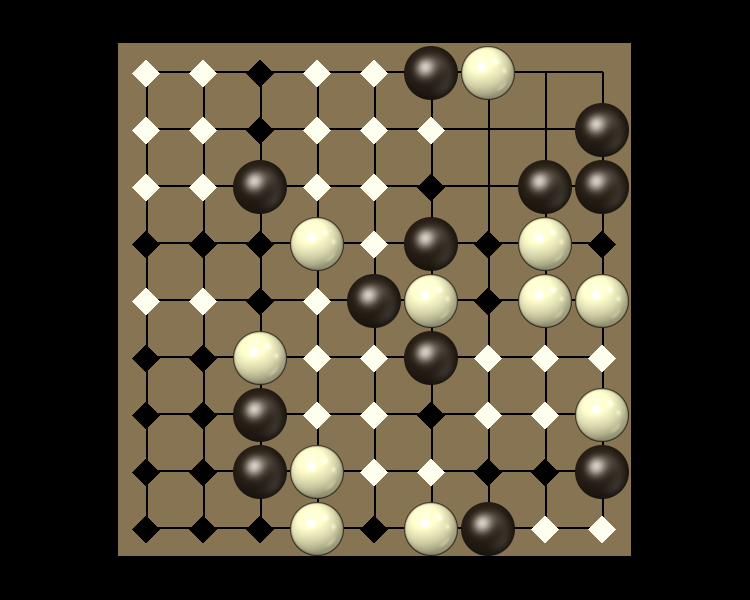
Representative game (in the sense of being of mean length). Wherever you see the 'representative game' referred to in later sections, this is it!

Introduction

Implo is a finite territory game for two players: Black and White. It is played on the intersections (points) of an initially empty 7x7 square board. Each player must have access to a sufficient number of stones and markers of their own color.

Definitions

In these rules, "adjacent" always means "orthogonally adjacent".

A group is a piece along with all other pieces one could reach from it through a series of steps between identical adjacent pieces. Thus, all pieces in a group are the same type (stone or marker) and color (black or white).

The size of a group is the number of pieces in it.

Likewise, a territory is an empty point along with all other points one could reach from it through a series of steps between adjacent empty points.

A patch is a territory including at most four points.

The owner of a patch is the player with the biggest group of stones adjacent to it. If there is no such group or the biggest such groups of both colors are the same size, the owner of the patch is the opponent of the player who placed the last stone on the board.

To resolve a patch is to place a marker of its owner's color on each of its points and to remove the biggest group of stones which is adjacent to the patch and owned by the same player as the patch. If several such groups are tied for biggest, the player who is resolving the patch removes, among those, one of their choosing. If there are no groups of stones adjacent to the patch, no group is removed. Note the player resolving the patch need not be the owner of the patch.

Play

Black plays first, then turns alternate. On your turn, perform these actions in order:

  1. Place a stone of your color on an empty point of the board.
  2. Resolve any single patch on the board.
  3. Repeat the previous step until no patches remain. Note the order of resolving matters, and resolving a patch may create new patches.

If, at the end of a player's turn, there are no empty points on the board, the game ends. The player with the higher score in the final position wins.

Your score is the biggest group size in which you have the greater number of groups of markers. If there is no such size, your score is zero. If both players are tied at zero points, whoever has more stones on the board wins. If this is also tied (only possible on even-sized boards), whoever made the last move loses.

Pie rule

The pie rule is used in order to make the game fair. This means White will have the option, on their first turn only, to swap sides with their opponent instead of making a regular move.

Miscellaneous

General comments:

Play: Combinatorial

Family: Combinatorial 2020

Mechanism(s): Connection,Scoring

BGG Stats

BGG EntryImplo
BGG Rating9
#Voters1
SD0
BGG Weight0
#Voters0
Year2020

BGG Ratings and Comments

UserRatingComment
luigi879My game.

Kolomogorov Complexity Analysis

Size (bytes)31978
Reference Size10293
Ratio3.11

Ai Ai calculates the size of the implementation, and compares it to the Ai Ai implementation of the simplest possible game (which just fills the board). Note that this estimate may include some graphics and heuristics code as well as the game logic. See the wikipedia entry for more details.

Playout Complexity Estimate

Playouts per second16726.41 (59.79µs/playout)
Reference Size369877.20 (2.70µs/playout)
Ratio (low is good)22.11

Tavener complexity: the heat generated by playing every possible instance of a game with a perfectly efficient programme. Since this is not possible to calculate, Ai Ai calculates the number of random playouts per second and compares it to the fastest non-trivial Ai Ai game (Connect 4). This ratio gives a practical indication of how complex the game is. Combine this with the computational state space, and you can get an idea of how strong the default (MCTS-based) AI will be.

Playout/Search Speed

LabelIts/sSDNodes/sSDGame lengthSD
Random playout18,0311731,696,62416,246949
search.UCBNaNNaN00
search.UCTNaNNaN00

Random: 10 second warmup for the hotspot compiler. 100 trials of 1000ms each.

Other: 100 playouts, means calculated over the first 5 moves only to avoid distortion due to speedup at end of game.

Mirroring Strategies

Rotation (Half turn) lost each game as expected.
Reflection (X axis) lost each game as expected.
Reflection (Y axis) lost each game as expected.
Copy last move lost each game as expected.

Mirroring strategies attempt to copy the previous move. On first move, they will attempt to play in the centre. If neither of these are possible, they will pick a random move. Each entry represents a different form of copying; direct copy, reflection in either the X or Y axis, half-turn rotation.

Win % By Player (Bias)

1: p1(Black) win %52.40±3.10Includes draws = 50%
2: p2(White) win %47.60±3.08Includes draws = 50%
Draw %0.00Percentage of games where all players draw.
Decisive %100.00Percentage of games with a single winner.
Samples1000Quantity of logged games played

Note: that win/loss statistics may vary depending on thinking time (horizon effect, etc.), bad heuristics, bugs, and other factors, so should be taken with a pinch of salt. (Given perfect play, any game of pure skill will always end in the same result.)

Note: Ai Ai differentiates between states where all players draw or win or lose; this is mostly to support cooperative games.

UCT Skill Chains

MatchAIStrong WinsDrawsStrong Losses#GamesStrong Scorep1 Win%Draw%p2 Win%Game Length
0Random         
1UCT (its=2)63103149450.6371 <= 0.6677 <= 0.697050.580.0049.4294.53
4UCT (its=5)63103139440.6378 <= 0.6684 <= 0.697751.800.0048.2093.75
13UCT (its=14)63103479780.6147 <= 0.6452 <= 0.674649.490.0050.5194.21
26UCT (its=27)63103229530.6315 <= 0.6621 <= 0.691449.740.0050.2693.95
42UCT (its=43)63103579880.6082 <= 0.6387 <= 0.668051.320.0048.6893.86
51
UCT (its=52)
554
0
446
1000
0.5230 <= 0.5540 <= 0.5845
50.80
0.00
49.20
93.46
52
UCT (its=52)
510
0
490
1000
0.4790 <= 0.5100 <= 0.5409
51.00
0.00
49.00
93.47

Search for levels ended: time limit reached.

Level of Play: Strong beats Weak 60% of the time (lower bound with 95% confidence).

Draw%, p1 win% and game length may give some indication of trends as AI strength increases.

1st Player Win Ratios by Playing Strength

This chart shows the win(green)/draw(black)/loss(red) percentages, as UCT play strength increases. Note that for most games, the top playing strength show here will be distinctly below human standard.

Complexity

Game length84.59 
Branching factor37.37 
Complexity10^113.02Based on game length and branching factor
Samples1000Quantity of logged games played

Computational complexity (where present) is an estimate of the game tree reachable through actual play. For each game in turn, Ai Ai marks the positions reached in a hashtable, then counts the number of new moves added to the table. Once all moves are applied, it treats this sequence as a geometric progression and calculates the sum as n-> infinity.

Move Classification

Distinct actions244Number of distinct moves (e.g. "e4") regardless of position in game tree
Killer moves26A 'killer' move is selected by the AI more than 50% of the time
Too many killers to list.
Good moves187A good move is selected by the AI more than the average
Bad moves57A bad move is selected by the AI less than the average
Response distance3.04Mean distance between move and response; a low value relative to the board size may mean a game is tactical rather than strategic.
Samples1000Quantity of logged games played

Board Coverage

A mean of 68.90% of board locations were used per game.

Colour and size show the frequency of visits.

Game Length

Game length frequencies.

Mean84.59
Mode[85]
Median85.0

Actions/turn

Table: branching factor per turn, based on a single representative* game. (* Representative in the sense that it is close to the mean game length.)

Action Types per Turn

This chart is based on a single representative* game, and gives a feel for the types of moves available throughout that game. (* Representative in the sense that it is close to the mean game length.)

Red: removal, Black: move, Blue: Add, Grey: pass, Purple: swap sides, Brown: other.

Trajectory

This chart shows the best move value with respect to the active player; the orange line represents the value of doing nothing (null move).

The lead changed on 30% of the game turns. Ai Ai found 11 critical turns (turns with only one good option).

Position Heatmap

This chart shows the relative temperature of all moves each turn. Colour range: black (worst), red, orange(even), yellow, white(best).

Good/Effective moves

MeasureAll playersPlayer 1Player 2
Mean % of effective moves26.8922.5131.37
Mean no. of effective moves4.223.954.50
Effective game space10^36.4410^17.8610^18.58
Mean % of good moves17.8724.1511.44
Mean no. of good moves3.314.372.21
Good move game space10^20.3010^14.0510^6.25

These figures were calculated over a single game.

An effective move is one with score 0.1 of the best move (including the best move). -1 (loss) <= score <= 1 (win)

A good move has a score > 0. Note that when there are no good moves, an multiplier of 1 is used for the game space calculation.

Quality Measures

MeasureValueDescription
Hot turns71.76%A hot turn is one where making a move is better than doing nothing.
Momentum29.41%% of turns where a player improved their score.
Correction34.12%% of turns where the score headed back towards equality.
Depth4.22%Difference in evaluation between a short and long search.
Drama1.68%How much the winner was behind before their final victory.
Foulup Factor17.65%Moves that looked better than the best move after a short search.
Surprising turns0.00%Turns that looked bad after a short search, but good after a long one.
Last lead change82.35%Distance through game when the lead changed for the last time.
Decisiveness14.12%Distance from the result being known to the end of the game.

These figures were calculated over a single representative* game, and based on the measures of quality described in "Automatic Generation and Evaluation of Recombination Games" (Cameron Browne, 2007). (* Representative, in the sense that it is close to the mean game length.)

Swap Heatmap (Full Scan)

Colour shows the frequency of swaps on turn 2 if this move is played on turn 1; black < red < yellow < white.

Based on 100 trials/move at 0.1s thinking time each.

Opening Heatmap

Colour shows the success ratio of this play over the first 10moves; black < red < yellow < white.

Size shows the frequency this move is played.

Swap Heatmap (Historic)

Colour shows the frequency of swaps on turn 2 if this move is played on turn 1; black < red < yellow < white.

Size shows the frequency this move is played.

Unique Positions Reachable at Depth

01234
181664226970610555366

Note: most games do not take board rotation and reflection into consideration.
Multi-part turns could be treated as the same or different depth depending on the implementation.
Counts to depth N include all moves reachable at lower depths.
Inaccuracies may also exist due to hash collisions, but Ai Ai uses 64-bit hashes so these will be a very small fraction of a percentage point.

Shortest Game(s)

No solutions found to depth 4.

Puzzles

PuzzleSolution

p1(Black) to win in 16 moves

p1(Black) to win in 27 moves

p2(White) to win in 15 moves

p1(Black) to win in 19 moves

p1(Black) to win in 20 moves

p1(Black) to win in 18 moves

p2(White) to win in 12 moves

p2(White) to win in 22 moves

p1(Black) to win in 15 moves

p1(Black) to win in 12 moves

p2(White) to win in 3 moves

p1(Black) to win in 21 moves

p2(White) to win in 8 moves

p2(White) to win in 12 moves

p2(White) to win in 8 moves

Weak puzzle selection criteria are in place; the first move may not be unique.