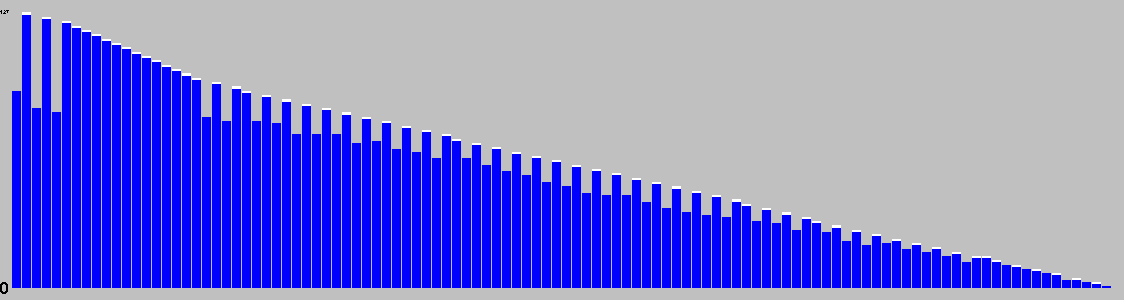
Change in Material Per Turn
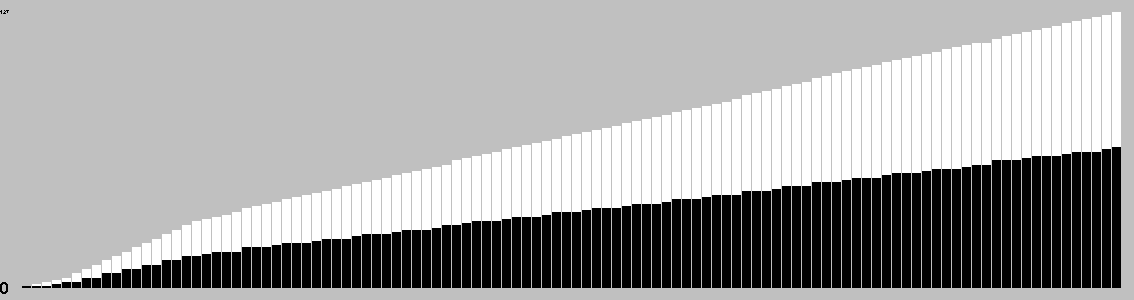
This chart is based on a single playout, and gives a feel for the change in material over the course of a game.
Black plays first.
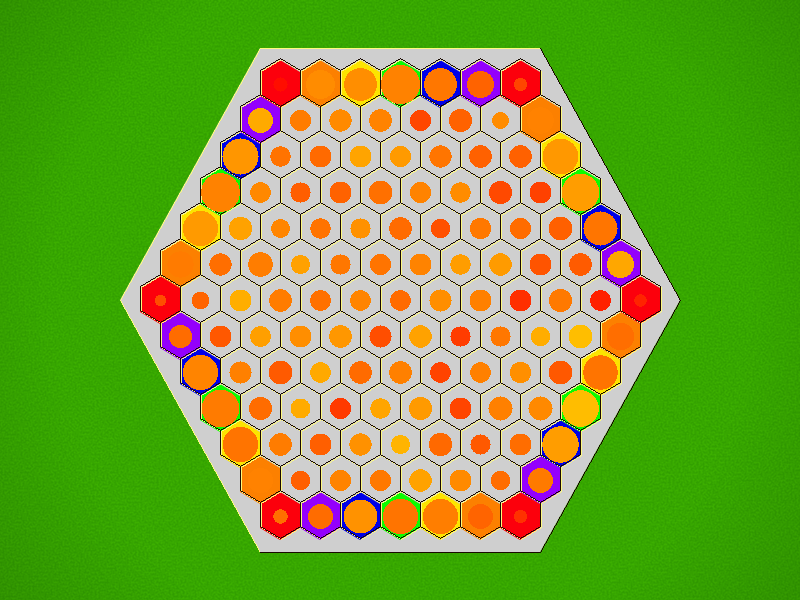
On the first turn, black plays a SINGLE stone to any gray cell. Thereafter, each player plays TWO stones per turn, subject to the following restrictions:
When the board is full or when both players consecutively pass, the game ends and players score their groups of stones. A groups score is equal to the number of coloured cells that it occupies. The player with the highest scoring group wins. If scores are tied, then players ignore their highest scoring group, and compare the highest scoring of their remaining groups. If still tied, then players compare their next highest scoring groups, etc., until the tie is broken. (Despite there being an even number of coloured cells, for subtle reasons having to do with board geometry, it turns out that draws are impossible.)
General comments:
Play: Combinatorial
Family: Connection,Scoring,Strict Placement,Combinatorial 2019
Mechanism(s): Scoring
Components: Board
Level: Standard
| BGG Entry | Iris |
|---|---|
| BGG Rating | 0 |
| #Voters | 0 |
| SD | 0 |
| BGG Weight | 0 |
| #Voters | 0 |
| Year | 2019 |
| User | Rating | Comment |
|---|---|---|
| mrraow | 7 | Interesting - and visually appealing - game with a fine balance between claiming outer cells and connecting them. There is an inspired rule that prevents playing two adjacent central stones, which makes bridges still valid most of the time, despite the 12* protocol; allowing your hex intuition to still function. there are, however, cases where you can attack two bridges in a way that only allows the opponent to defend one of them. |
| AI | Strong Wins | Draws | Strong Losses | #Games | Strong Win% | p1 Win% | Game Length |
|---|---|---|---|---|---|---|---|
| Random | |||||||
| Grand Unified UCT(U1-T,rSel=s, secs=0.01) | 36 | 0 | 0 | 36 | 100.00 | 44.44 | 94.14 |
| Grand Unified UCT(U1-T,rSel=s, secs=0.03) | 36 | 0 | 4 | 40 | 90.00 | 40.00 | 106.12 |
| Grand Unified UCT(U1-T,rSel=s, secs=0.07) | 36 | 0 | 6 | 42 | 85.71 | 50.00 | 109.33 |
| Grand Unified UCT(U1-T,rSel=s, secs=0.20) | 36 | 0 | 6 | 42 | 85.71 | 59.52 | 109.74 |
| Grand Unified UCT(U1-T,rSel=s, secs=0.55) | 36 | 0 | 9 | 45 | 80.00 | 48.89 | 109.71 |
Level of Play: Strong beats Weak 60% of the time (lower bound with 90% confidence).
Draw%, p1 win% and game length may give some indication of trends as AI strength increases; but be aware that the AI can introduce bias due to horizon effects, poor heuristics, etc.
| Size (bytes) | 29828 |
|---|---|
| Reference Size | 10293 |
| Ratio | 2.90 |
Ai Ai calculates the size of the implementation, and compares it to the Ai Ai implementation of the simplest possible game (which just fills the board). Note that this estimate may include some graphics and heuristics code as well as the game logic. See the wikipedia entry for more details.
| Playouts per second | 19673.50 (50.83µs/playout) |
|---|---|
| Reference Size | 350324.05 (2.85µs/playout) |
| Ratio (low is good) | 17.81 |
Tavener complexity: the heat generated by playing every possible instance of a game with a perfectly efficient programme. Since this is not possible to calculate, Ai Ai calculates the number of random playouts per second and compares it to the fastest non-trivial Ai Ai game (Connect 4). This ratio gives a practical indication of how complex the game is. Combine this with the computational state space, and you can get an idea of how strong the default (MCTS-based) AI will be.
| 1: Black win % | 49.10±3.09 | Includes draws = 50% |
|---|---|---|
| 2: White win % | 50.90±3.10 | Includes draws = 50% |
| Draw % | 0.00 | Percentage of games where all players draw. |
| Decisive % | 100.00 | Percentage of games with a single winner. |
| Samples | 1000 | Quantity of logged games played |
Note: that win/loss statistics may vary depending on thinking time (horizon effect, etc.), bad heuristics, bugs, and other factors, so should be taken with a pinch of salt. (Given perfect play, any game of pure skill will always end in the same result.)
Note: Ai Ai differentiates between states where all players draw or win or lose; this is mostly to support cooperative games.
| Label | Its/s | SD | Nodes/s | SD | Game length | SD |
|---|---|---|---|---|---|---|
| Random playout | 36,915 | 119 | 4,050,635 | 12,850 | 110 | 6 |
| search.UCB | 37,313 | 692 | 110 | 1 | ||
| search.UCT | 36,821 | 780 | 110 | 3 |
Random: 10 second warmup for the hotspot compiler. 100 trials of 1000ms each.
Other: 100 playouts, means calculated over the first 5 moves only to avoid distortion due to speedup at end of game.
Rotation (Half turn) lost each game as expected.
Reflection (X axis) lost each game as expected.
Reflection (Y axis) lost each game as expected.
Copy last move lost each game as expected.
Mirroring strategies attempt to copy the previous move. On first move, they will attempt to play in the centre. If neither of these are possible, they will pick a random move. Each entry represents a different form of copying; direct copy, reflection in either the X or Y axis, half-turn rotation.
| Game length | 108.80 | |
|---|---|---|
| Branching factor | 56.14 | |
| Complexity | 10^176.23 | Based on game length and branching factor |
| Samples | 1000 | Quantity of logged games played |
Computational complexity (where present) is an estimate of the game tree reachable through actual play. For each game in turn, Ai Ai marks the positions reached in a hashtable, then counts the number of new moves added to the table. Once all moves are applied, it treats this sequence as a geometric progression and calculates the sum as n-> infinity.
| Distinct actions | 128 | Number of distinct moves (e.g. "e4") regardless of position in game tree |
|---|---|---|
| Good moves | 34 | A good move is selected by the AI more than the average |
| Bad moves | 94 | A bad move is selected by the AI less than the average |
| Samples | 1000 | Quantity of logged games played |
This chart is based on a single playout, and gives a feel for the change in material over the course of a game.
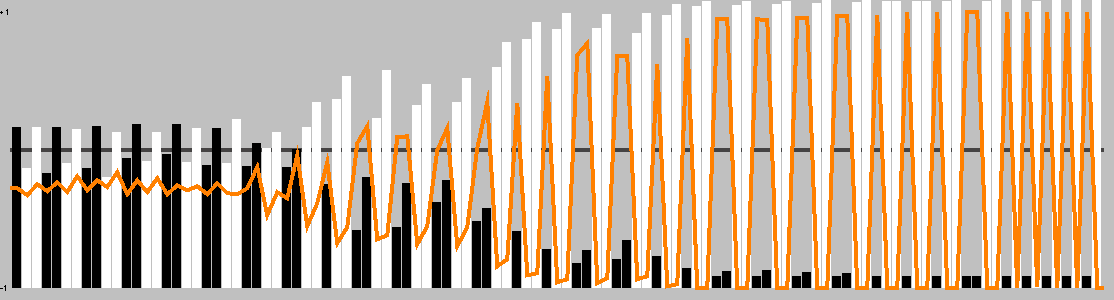
This chart shows the best move value with respect to the active player; the orange line represents the value of doing nothing (null move).
The lead changed on 11% of the game turns. Ai Ai found 0 critical turns (turns with only one good option).
Overall, this playout was 88.07% hot.
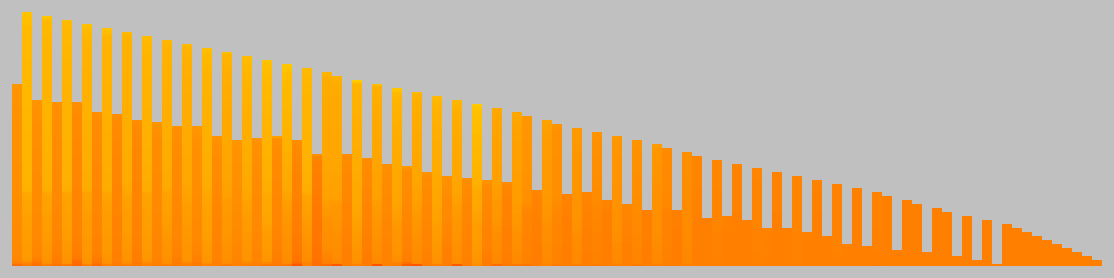
This chart shows the relative temperature of all moves each turn. Colour range: black (worst), red, orange(even), yellow, white(best).
| Measure | All players | Player 1 | Player 2 |
|---|---|---|---|
| Mean % of effective moves | 71.81 | 68.44 | 74.67 |
| Mean no. of effective moves | 31.31 | 31.28 | 31.34 |
| Effective game space | 10^146.35 | 10^67.45 | 10^78.90 |
| Mean % of good moves | 40.07 | 79.59 | 6.58 |
| Mean no. of good moves | 23.37 | 41.80 | 7.75 |
| Good move game space | 10^80.66 | 10^68.85 | 10^11.81 |
These figures were calculated over a single game.
An effective move is one with score 0.1 of the best move (including the best move). -1 (loss) <= score <= 1 (win)
A good move has a score > 0. Note that when there are no good moves, an multiplier of 1 is used for the game spce calculation.
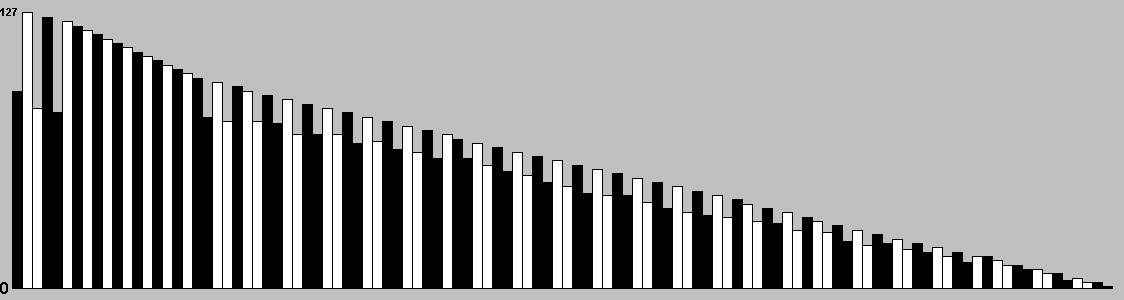
Table: branching factor per turn.
This chart is based on a single playout, and gives a feel for the types of moves available over the course of a game.
Red: removal, Black: move, Blue: Add, Grey: pass, Purple: swap sides, Brown: other.
| 0 | 1 | 2 | 3 | 4 |
|---|---|---|---|---|
| 1 | 91 | 10010 | 539928 | 42663016 |
Note: most games do not take board rotation and reflection into consideration.
Multi-part turns could be treated as the same or different depth depending on the implementation.
Counts to depth N include all moves reachable at lower depths.
Inaccuracies may also exist due to hash collisions, but Ai Ai uses 64-bit hashes so these will be a very small fraction of a percentage point.


91 solutions found at depth 3.
Colour shows the success ratio of this play over the first 10moves; black < red < yellow < white.
Size shows the frequency this move is played.