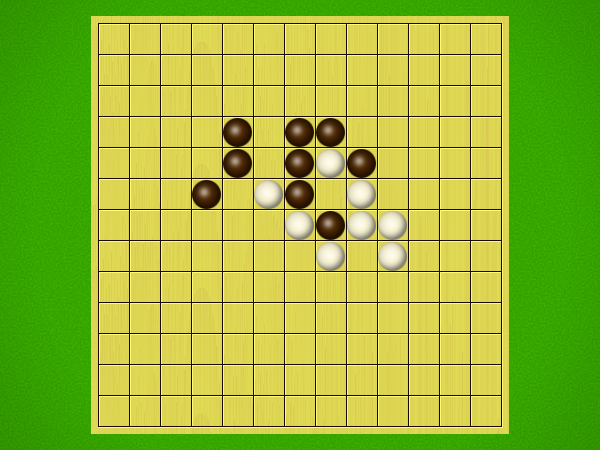
Full Report for Knight Light by Stephen Tavener

Full Report for Knight Light by Stephen Tavener

Make a row of 4, with knight's moves.

Generated at 10/10/2020, 15:08 from 14871 logged games.

Rules

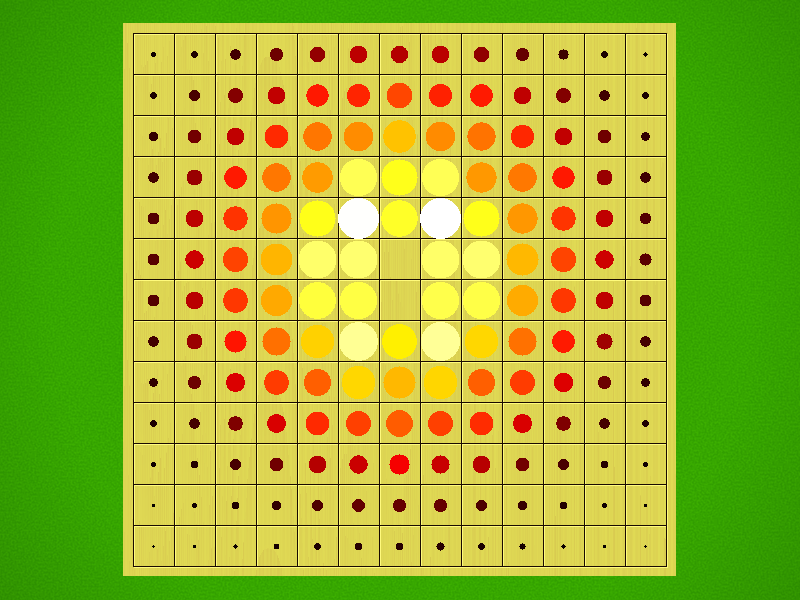
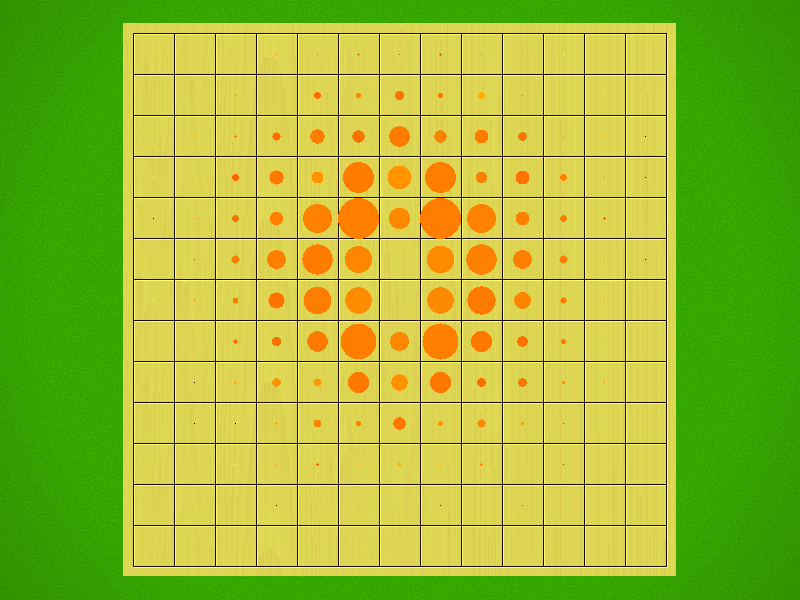
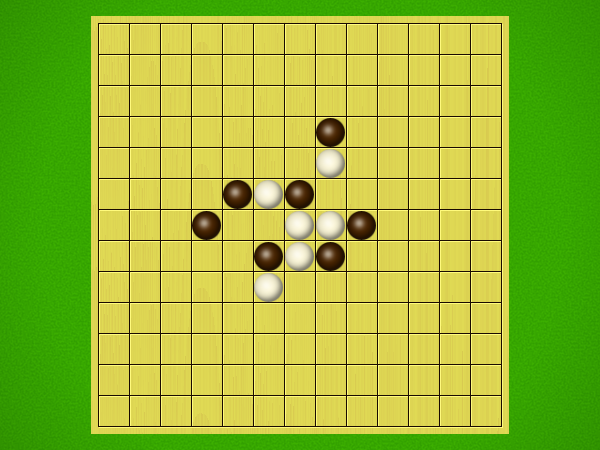
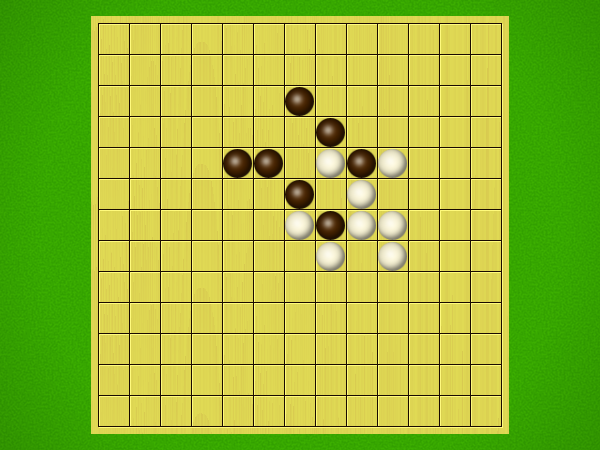
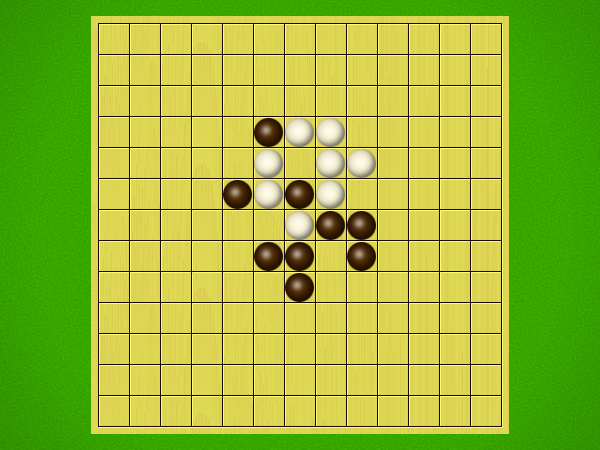
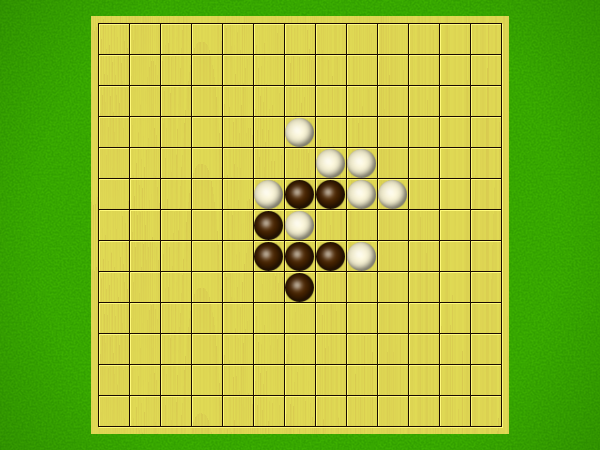
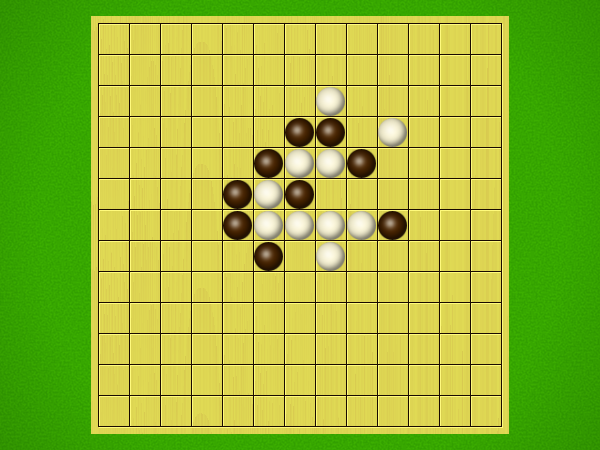
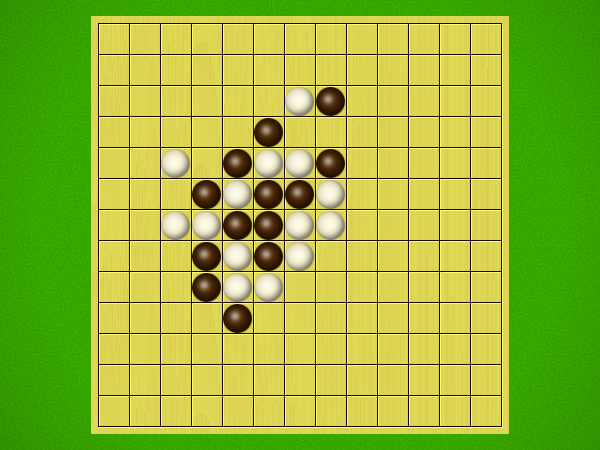
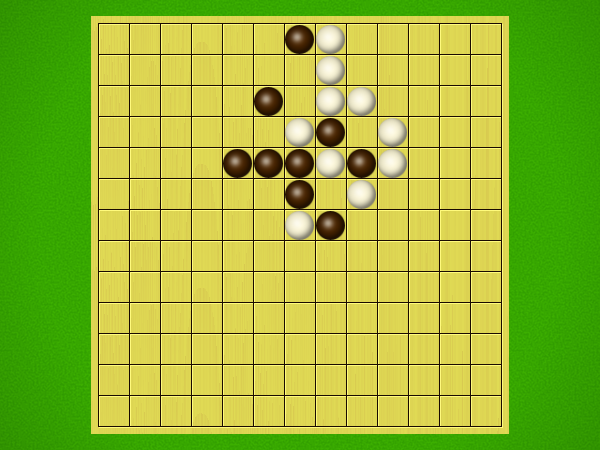
Representative game (in the sense of being of mean length). Wherever you see the 'representative game' referred to in later sections, this is it!

Place a piece exactly one knight's move away from another piece of your colour. All pieces on the board must be connected. First to make a line of 5 wins.

Miscellaneous

General comments:

Play: Combinatorial,Multiplayer

Mechanism(s): Line,Stacking,Movement

BGG Stats

BGG EntryKnight Light
BGG Ratingnull
#Votersnull
SDnull
BGG Weightnull
#Votersnull
Yearnull

Kolomogorov Complexity Analysis

Size (bytes)22670
Reference Size10293
Ratio2.20

Ai Ai calculates the size of the implementation, and compares it to the Ai Ai implementation of the simplest possible game (which just fills the board). Note that this estimate may include some graphics and heuristics code as well as the game logic. See the wikipedia entry for more details.

Playout Complexity Estimate

Playouts per second6896.86 (144.99µs/playout)
Reference Size1558846.45 (0.64µs/playout)
Ratio (low is good)226.02

Tavener complexity: the heat generated by playing every possible instance of a game with a perfectly efficient programme. Since this is not possible to calculate, Ai Ai calculates the number of random playouts per second and compares it to the fastest non-trivial Ai Ai game (Connect 4). This ratio gives a practical indication of how complex the game is. Combine this with the computational state space, and you can get an idea of how strong the default (MCTS-based) AI will be.

Playout/Search Speed

LabelIts/sSDNodes/sSDGame lengthSD
Random playout8,164536540,38835,1676624
search.UCB8,278300215
search.UCT8,400268215

Random: 10 second warmup for the hotspot compiler. 100 trials of 1000ms each.

Other: 100 playouts, means calculated over the first 5 moves only to avoid distortion due to speedup at end of game.

Mirroring Strategies

Rotation (Half turn) lost each game as expected.
Reflection (X axis) lost each game as expected.
Reflection (Y axis) lost each game as expected.
Copy last move lost each game as expected.

Mirroring strategies attempt to copy the previous move. On first move, they will attempt to play in the centre. If neither of these are possible, they will pick a random move. Each entry represents a different form of copying; direct copy, reflection in either the X or Y axis, half-turn rotation.

Win % By Player (Bias)

1: White win %49.24±0.80Includes draws = 50%
2: Black win %50.76±0.80Includes draws = 50%
Draw %0.01Percentage of games where all players draw.
Decisive %99.99Percentage of games with a single winner.
Samples14871Quantity of logged games played

Note: that win/loss statistics may vary depending on thinking time (horizon effect, etc.), bad heuristics, bugs, and other factors, so should be taken with a pinch of salt. (Given perfect play, any game of pure skill will always end in the same result.)

Note: Ai Ai differentiates between states where all players draw or win or lose; this is mostly to support cooperative games.

UCT Skill Chains

MatchAIStrong WinsDrawsStrong Losses#GamesStrong Scorep1 Win%Draw%p2 Win%Game Length
0Random         
2UCT (its=5)63102648950.6743 <= 0.7050 <= 0.734049.270.0050.7360.09
5UCT (its=109)6310937240.8452 <= 0.8715 <= 0.894049.030.0050.9742.76
6UCT (its=297)63101898200.7395 <= 0.7695 <= 0.797048.660.0051.3427.98
7UCT (its=807)63101938240.7357 <= 0.7658 <= 0.793450.360.0049.6422.49
8
UCT (its=2193)
440
0
168
608
0.6868 <= 0.7237 <= 0.7577
48.68
0.00
51.32
19.20
9
UCT (its=2193)
505
0
495
1000
0.4741 <= 0.5050 <= 0.5359
48.10
0.00
51.90
18.22

Search for levels ended: time limit reached.

Level of Play: Strong beats Weak 60% of the time (lower bound with 95% confidence).

Draw%, p1 win% and game length may give some indication of trends as AI strength increases.

1st Player Win Ratios by Playing Strength

This chart shows the win(green)/draw(black)/loss(red) percentages, as UCT play strength increases. Note that for most games, the top playing strength show here will be distinctly below human standard.

Complexity

Game length43.11 
Branching factor31.46 
Complexity10^63.15Based on game length and branching factor
Computational Complexity10^7.20Sample quality (100 best): 65.01
Samples14871Quantity of logged games played

Computational complexity (where present) is an estimate of the game tree reachable through actual play. For each game in turn, Ai Ai marks the positions reached in a hashtable, then counts the number of new moves added to the table. Once all moves are applied, it treats this sequence as a geometric progression and calculates the sum as n-> infinity.

Move Classification

Distinct actions168Number of distinct moves (e.g. "e4") regardless of position in game tree
Good moves22A good move is selected by the AI more than the average
Bad moves145A bad move is selected by the AI less than the average
Response distance2.23Mean distance between move and response; a low value relative to the board size may mean a game is tactical rather than strategic.
Samples14871Quantity of logged games played

Board Coverage

A mean of 25.51% of board locations were used per game.

Colour and size show the frequency of visits.

Game Length

Game length frequencies.

Mean43.11
Mode[17]
Median39.0

Change in Material Per Turn

This chart is based on a single representative* playout, and gives a feel for the change in material over the course of a game. (* Representative in the sense that it is close to the mean length.)

Actions/turn

Table: branching factor per turn, based on a single representative* game. (* Representative in the sense that it is close to the mean game length.)

Action Types per Turn

This chart is based on a single representative* game, and gives a feel for the types of moves available throughout that game. (* Representative in the sense that it is close to the mean game length.)

Red: removal, Black: move, Blue: Add, Grey: pass, Purple: swap sides, Brown: other.

Trajectory

This chart shows the best move value with respect to the active player; the orange line represents the value of doing nothing (null move).

The lead changed on 39% of the game turns. Ai Ai found 3 critical turns (turns with only one good option).

Position Heatmap

This chart shows the relative temperature of all moves each turn. Colour range: black (worst), red, orange(even), yellow, white(best).

Good/Effective moves

MeasureAll playersPlayer 1Player 2
Mean % of effective moves51.4049.7652.97
Mean no. of effective moves14.1913.7114.64
Effective game space10^34.0310^14.9510^19.08
Mean % of good moves42.6841.6843.64
Mean no. of good moves13.9812.7615.14
Good move game space10^31.3610^14.7910^16.57

These figures were calculated over a single game.

An effective move is one with score 0.1 of the best move (including the best move). -1 (loss) <= score <= 1 (win)

A good move has a score > 0. Note that when there are no good moves, an multiplier of 1 is used for the game space calculation.

Quality Measures

MeasureValueDescription
Hot turns100.00%A hot turn is one where making a move is better than doing nothing.
Momentum34.88%% of turns where a player improved their score.
Correction41.86%% of turns where the score headed back towards equality.
Depth4.11%Difference in evaluation between a short and long search.
Drama0.40%How much the winner was behind before their final victory.
Foulup Factor48.84%Moves that looked better than the best move after a short search.
Surprising turns0.00%Turns that looked bad after a short search, but good after a long one.
Last lead change93.02%Distance through game when the lead changed for the last time.
Decisiveness9.30%Distance from the result being known to the end of the game.

These figures were calculated over a single representative* game, and based on the measures of quality described in "Automatic Generation and Evaluation of Recombination Games" (Cameron Browne, 2007). (* Representative, in the sense that it is close to the mean game length.)

Openings

MovesAnimation
f9,f10,f6,e11,g10,e9,e8,h8,h9,d9
f9,f10,f6,e11,g10,e8,e9,h8,h9,d9
f9,f10,e9,e11,g10,f6,e8,h8,h9,d9

Opening Heatmap

Colour shows the success ratio of this play over the first 10moves; black < red < yellow < white.

Size shows the frequency this move is played.

Unique Positions Reachable at Depth

0123456789
121040243134910328697555520673856354

Note: most games do not take board rotation and reflection into consideration.
Multi-part turns could be treated as the same or different depth depending on the implementation.
Counts to depth N include all moves reachable at lower depths.
Inaccuracies may also exist due to hash collisions, but Ai Ai uses 64-bit hashes so these will be a very small fraction of a percentage point.

Shortest Game(s)

No solutions found to depth 9.

Puzzles

PuzzleSolution

White to win in 6 moves

Black to win in 6 moves

Black to win in 2 moves

White to win in 2 moves

White to win in 2 moves

Black to win in 2 moves

White to win in 2 moves

Black to win in 2 moves

Black to win in 2 moves

Black to win in 2 moves

Black to win in 2 moves

White to win in 2 moves

Weak puzzle selection criteria are in place; the first move may not be unique.