Full Report for Knight Vision by Christian Freeling
Full Report for Knight Vision by Christian Freeling
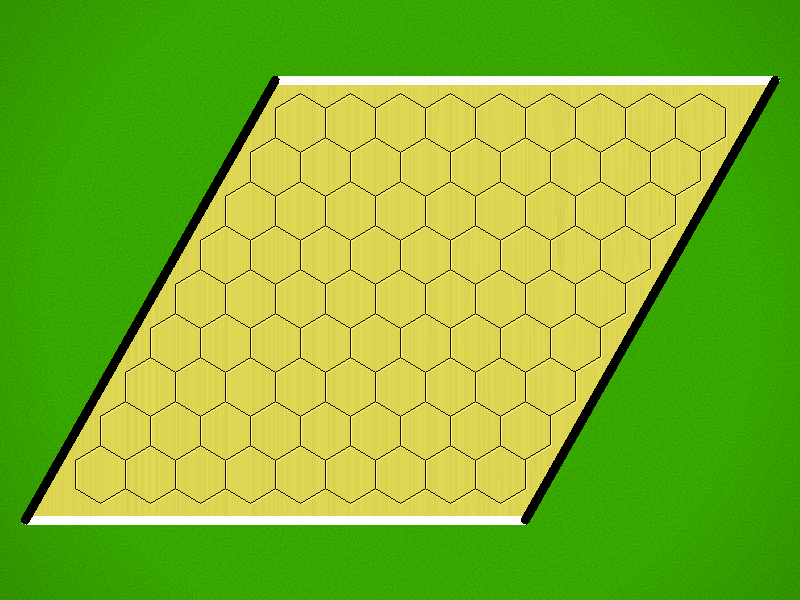
KnightVision is a connection game featuring placement, movement and capture. Its ancestors are Hex and Cannons & Bullets.
Generated at 2023-07-18, 04:20 from 1000 logged games.
Rules
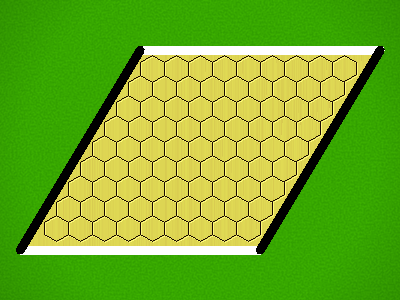
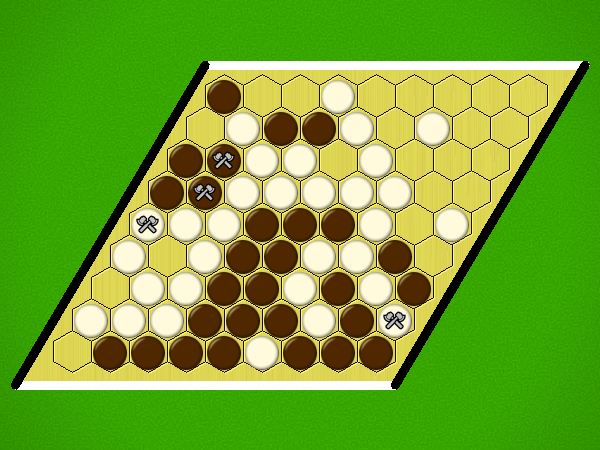
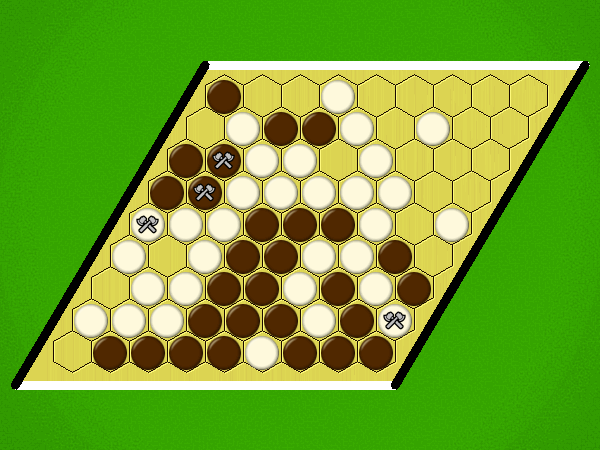
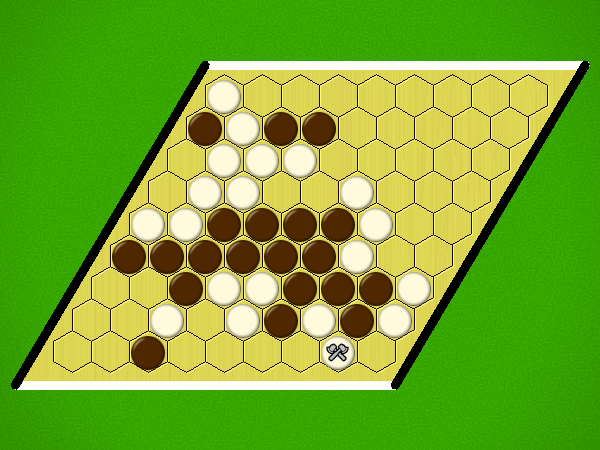
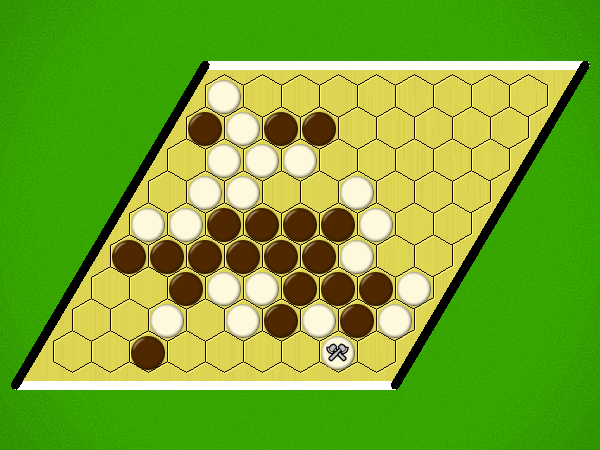
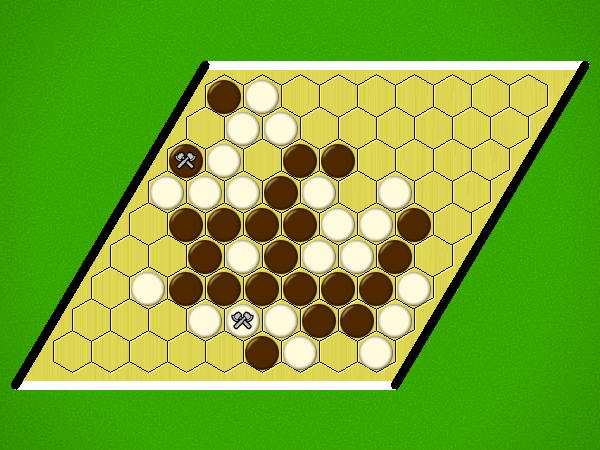
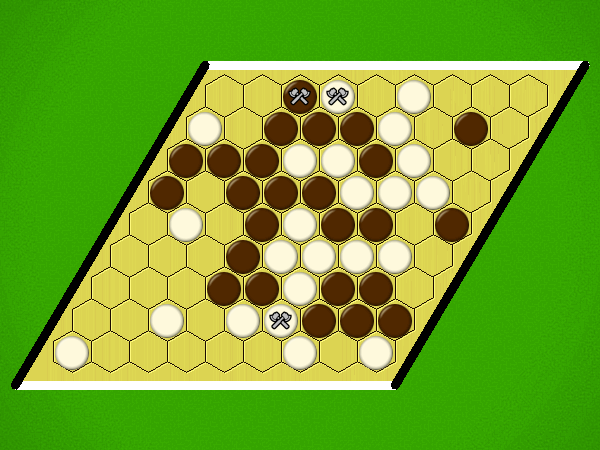
Representative game (in the sense of being of mean length). Wherever you see the 'representative game' referred to in later sections, this is it!
Rules
The board is initially empty. Player 1 places one white knight on a cell. Player 2 then decides whether to play with or against White.
The second player's first move is also a free placement. From that point onwards, players on their turn must either:
occupy a vacant cell by placement, or ...
... throw an axe.
To occupy a vacant cell, it must be at a knight's move of at least one friendly piece. If the number of friendly pieces that are at a knight's move of the placed piece is three or more, then the player may place a stack of two men. The bottom man of a stack is still a Knight, but the man on top is now the AXE.
If an axe is thrown, it moves rookwise, unobstructed by friendly pieces and it may land on a vacant cell or on the first opponent's piece it encounters. That piece is then captured and removed from play, both knight and axe if applicable, and replaced by the moving axe that becomes a knight in the process. Making a placement or a move is mandatory unless neither is possible. In that case a player must pass.
Goal
If a player finds a solid cell to cell connection with his pieces between the two edges of his colour when it is his turn, then he has won. It means that any connection made, must outlive the next turn, a turn in which the opponent can still break it by capture.
Ai Ai calculates the size of the implementation, and compares it to the Ai Ai implementation of the simplest possible game (which just fills the board). Note that this estimate may include some graphics and heuristics code as well as the game logic. See the wikipedia entry for more details.
Playout Complexity Estimate
Playouts per second
20379.05 (49.07µs/playout)
Reference Size
572049.65 (1.75µs/playout)
Ratio (low is good)
28.07
Tavener complexity: the heat generated by playing every possible instance of a game with a perfectly efficient programme. Since this is not possible to calculate, Ai Ai calculates the number of random playouts per second and compares it to the fastest non-trivial Ai Ai game (Connect 4). This ratio gives a practical indication of how complex the game is. Combine this with the computational state space, and you can get an idea of how strong the default (MCTS-based) AI will be.
State Space Complexity
% new positions/bucket
State Space Complexity
70022848
State Space Complexity bounds
64142884 < 70022848 < ∞
State Space Complexity (log 10)
7.85
State Space Complexity bounds (log 10)
7.81 <= 7.85 <= ∞
Samples
947181
Confidence
0.00
0: totally unreliable, 100: perfect
State space complexity (where present) is an estimate of the number of distinct game tree reachable through actual play. Over a series of random games, Ai Ai checks each position to see if it is new, or a repeat of a previous position and keeps a total for each game. As the number of games increase, the quantity of new positions seen per game decreases. These games are then partitioned into a number of buckets, and if certain conditions are met, Ai Ai treats the number in each bucket as the start of a strictly decreasing geometric sequence and sums it to estimate the total state space. The accuracy is calculated as 1-[end bucket count]/[starting bucklet count]
Playout/Search Speed
Label
Its/s
SD
Nodes/s
SD
Game length
SD
Random playout
22,599
356
1,636,139
25,719
72
12
search.UCT
23,157
445
45
12
Random: 10 second warmup for the hotspot compiler. 100 trials of 1000ms each.
Other: 100 playouts, means calculated over the first 5 moves only to avoid distortion due to speedup at end of game.
Mirroring Strategies
Rotation (Half turn) lost each game as expected.
Reflection (X axis) lost each game as expected.
Reflection (Y axis) lost each game as expected.
Copy last move lost each game as expected.
Mirroring strategies attempt to copy the previous move. On first move, they will attempt to play in the centre. If neither of these are possible, they will pick a random move. Each entry represents a different form of copying; direct copy, reflection in either the X or Y axis, half-turn rotation.
Win % By Player (Bias)
1: Player 1 (White) win %
52.50±3.10
Includes draws = 50%
2: Player 2 (Black) win %
47.50±3.08
Includes draws = 50%
Draw %
0.00
Percentage of games where all players draw.
Decisive %
100.00
Percentage of games with a single winner.
Samples
1000
Quantity of logged games played
Note: that win/loss statistics may vary depending on thinking time (horizon effect, etc.), bad heuristics, bugs, and other factors, so should be taken with a pinch of salt. (Given perfect play, any game of pure skill will always end in the same result.)
Note: Ai Ai differentiates between states where all players draw or win or lose; this is mostly to support cooperative games.
UCT Skill Chains
Match
AI
Strong Wins
Draws
Strong Losses
#Games
Strong Score
p1 Win%
Draw%
p2 Win%
Game Length
0
Random
1
UCT (its=2)
631
0
347
978
0.6147 <= 0.6452 <= 0.6746
51.74
0.00
48.26
70.50
4
UCT (its=5)
631
0
344
975
0.6167 <= 0.6472 <= 0.6765
46.67
0.00
53.33
68.74
16
UCT (its=17)
631
0
358
989
0.6076 <= 0.6380 <= 0.6674
51.97
0.00
48.03
69.02
30
UCT (its=31)
631
0
353
984
0.6108 <= 0.6413 <= 0.6706
47.87
0.00
52.13
68.30
41
UCT (its=42)
631
0
362
993
0.6050 <= 0.6354 <= 0.6648
49.14
0.00
50.86
68.11
57
UCT (its=58)
631
0
354
985
0.6102 <= 0.6406 <= 0.6700
49.34
0.00
50.66
66.42
65
UCT (its=66)
530
0
470
1000
0.4990 <= 0.5300 <= 0.5608
49.20
0.00
50.80
64.68
66
UCT (its=66)
494
0
506
1000
0.4631 <= 0.4940 <= 0.5250
50.80
0.00
49.20
63.87
Search for levels ended: time limit reached.
Level of Play: Strong beats Weak 60% of the time (lower bound with 95% confidence).
Draw%, p1 win% and game length may give some indication of trends as AI strength increases.
1st Player Win Ratios by Playing Strength
This chart shows the win(green)/draw(black)/loss(red) percentages, as UCT play strength increases. Note that for most games, the top playing strength show here will be distinctly below human standard.
Complexity
Game length
56.15
Branching factor
34.60
Complexity
10^84.06
Based on game length and branching factor
Samples
1000
Quantity of logged games played
Computational complexity (where present) is an estimate of the game tree reachable through actual play. For each game in turn, Ai Ai marks the positions reached in a hashtable, then counts the number of new moves added to the table. Once all moves are applied, it treats this sequence as a geometric progression and calculates the sum as n-> infinity.
Move Classification
Board Size
81
Quantity of distinct board cells
Distinct actions
1715
Quantity of distinct moves (e.g. "e4") regardless of position in game tree
Killer moves
4
A 'killer' move is selected by the AI more than 50% of the time Killers: h8-h2,g9-g4,i1-d6,i8-e8
Good moves
892
A good move is selected by the AI more than the average
Bad moves
823
A bad move is selected by the AI less than the average
Terrible moves
329
A terrible move is never selected by the AI Too many terrible moves to list.
Response distance%
18.87%
Distance from move to response / maximum board distance; a low value suggests a game is tactical rather than strategic.
Samples
1000
Quantity of logged games played
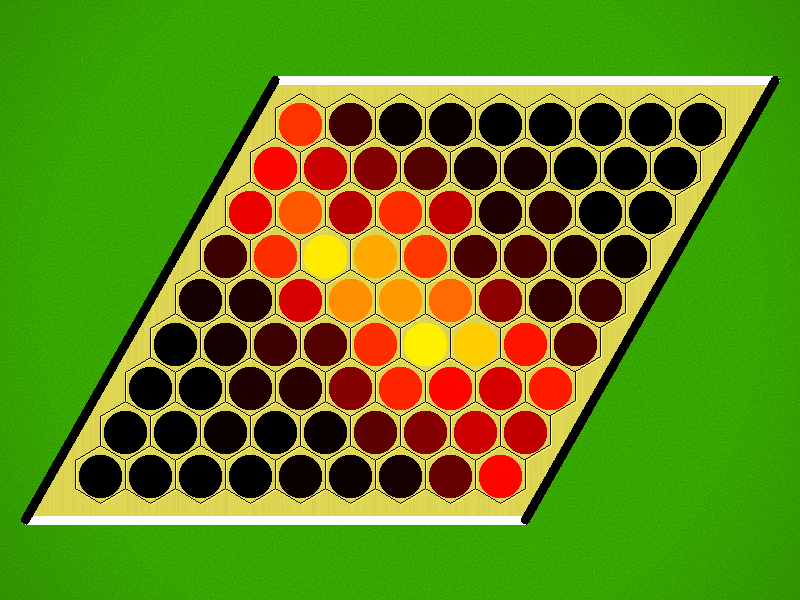
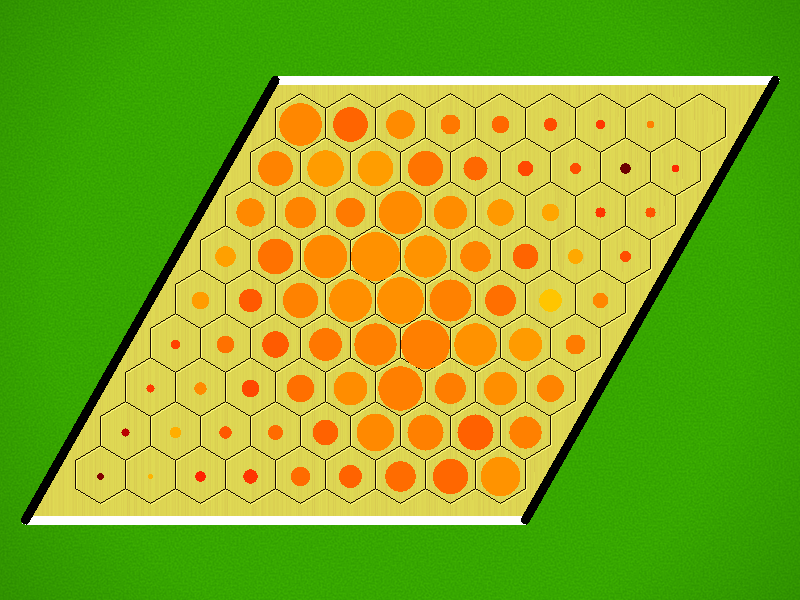
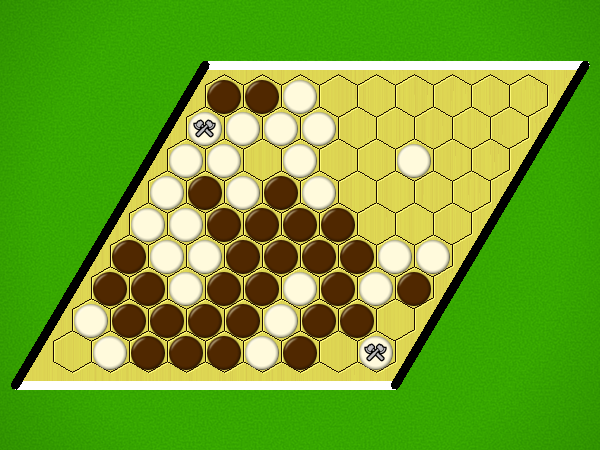
Board Coverage
A mean of 55.73% of board locations were used per game.
Colour and size show the frequency of visits.
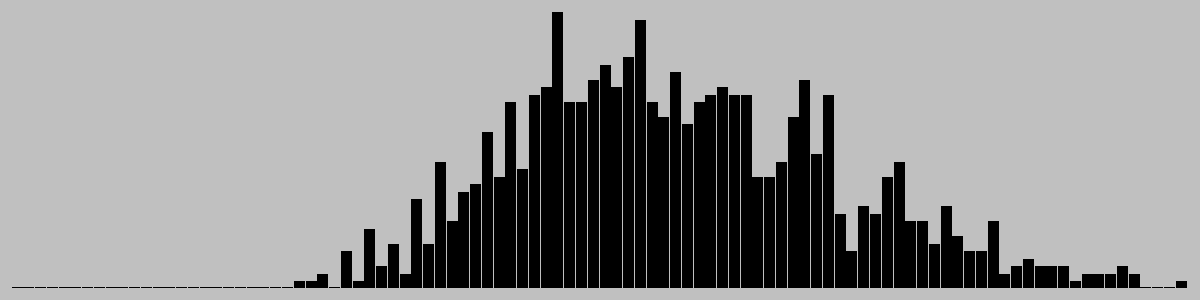
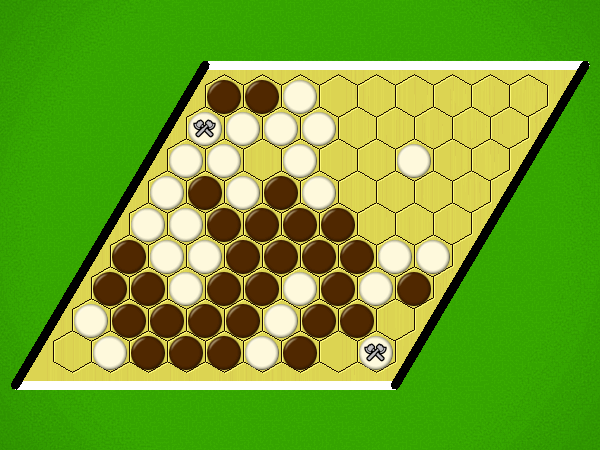
Game Length
Game length frequencies.
Mean
56.15
Mode
[46]
Median
55.0
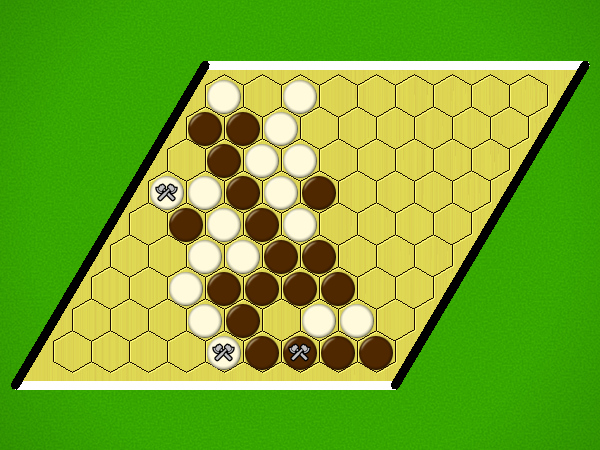
Change in Material Per Turn
Mean change in material/round
0.84
Complete round of play (all players)
This chart is based on a single representative* playout, and gives a feel for the change in material over the course of a game. (* Representative in the sense that it is close to the mean length.)
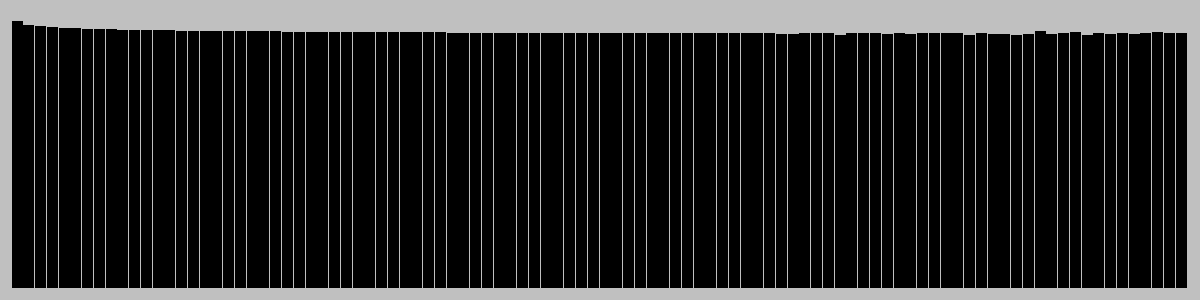
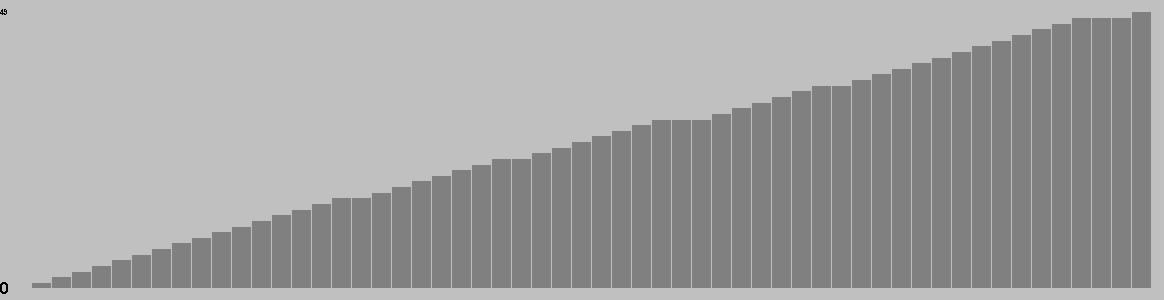
Actions/turn
Table: branching factor per turn, based on a single representative* game. (* Representative in the sense that it is close to the mean game length.)
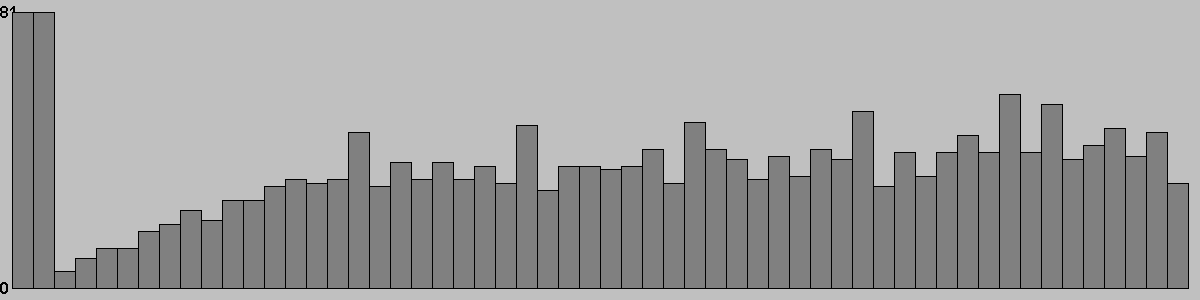
Action Types per Turn
This chart is based on a single representative* game, and gives a feel for the types of moves available throughout that game. (* Representative in the sense that it is close to the mean game length.)
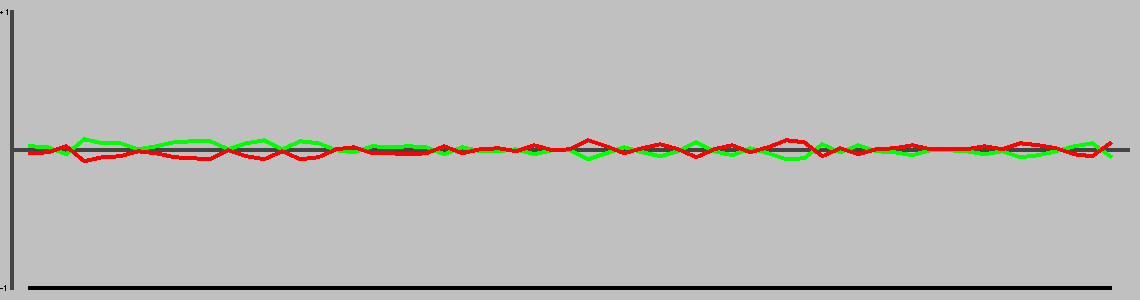
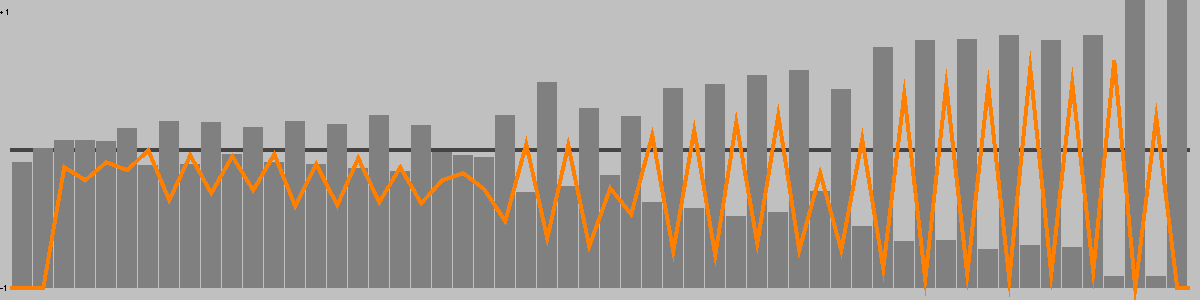
This chart shows the best move value with respect to the active player; the orange line represents the value of doing nothing (null move).
The lead changed on 10% of the game turns. Ai Ai found 1 critical turn (turns with only one good option).
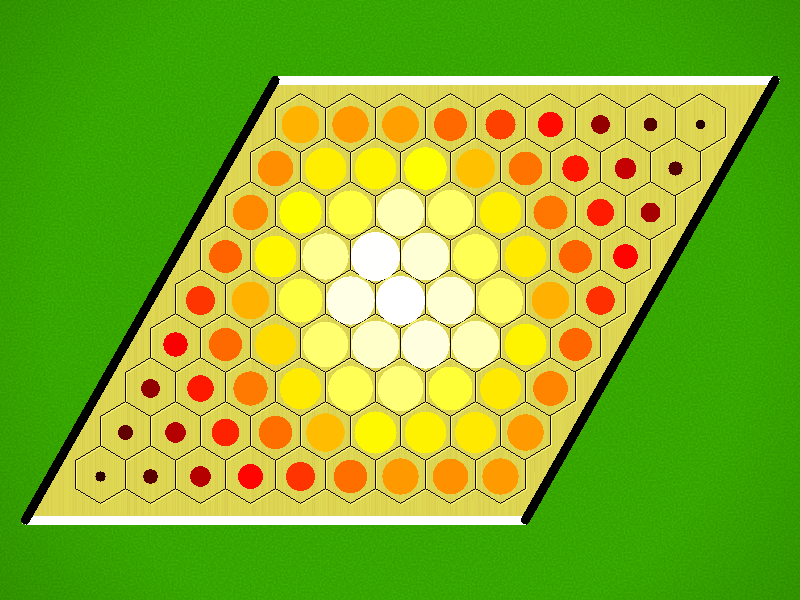
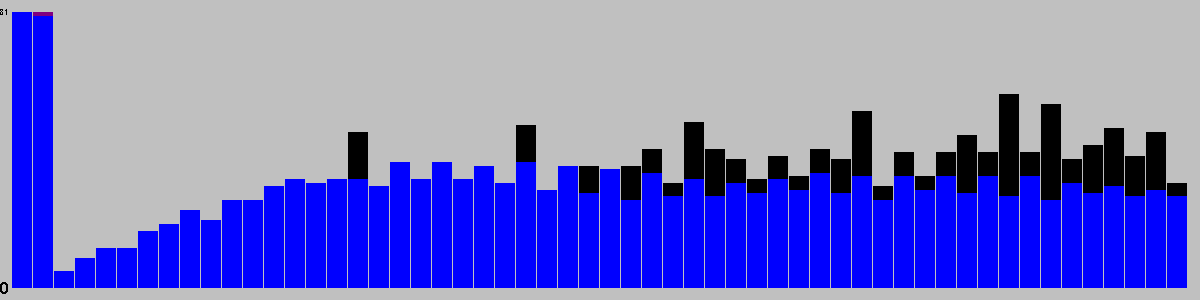
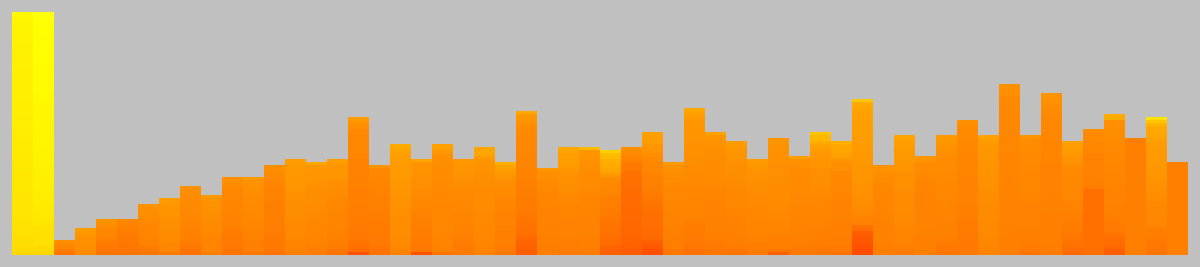
Position Heatmap
This chart shows the relative temperature of all moves each turn. Colour range: black (worst), red, orange(even), yellow, white(best).
Good/Effective moves
Measure
All players
Player 1
Player 2
Mean % of effective moves
15.71
9.99
21.43
Mean no. of effective moves
4.59
2.46
6.71
Effective game space
10^24.55
10^8.66
10^15.89
Mean % of good moves
30.78
60.63
0.93
Mean no. of good moves
11.96
23.57
0.36
Good move game space
10^33.74
10^32.59
10^1.15
These figures were calculated over a single game.
An effective move is one with score 0.1 of the best move (including the best move). -1 (loss) <= score <= 1 (win)
A good move has a score > 0. Note that when there are no good moves, an multiplier of 1 is used for the game space calculation.
Quality Measures
Measure
Value
Description
Hot turns
96.43%
A hot turn is one where making a move is better than doing nothing.
Momentum
28.57%
% of turns where a player improved their score.
Correction
33.93%
% of turns where the score headed back towards equality.
Depth
2.15%
Difference in evaluation between a short and long search.
Drama
0.00%
How much the winner was behind before their final victory.
Foulup Factor
17.86%
Moves that looked better than the best move after a short search.
Surprising turns
1.79%
Turns that looked bad after a short search, but good after a long one.
Last lead change
41.07%
Distance through game when the lead changed for the last time.
Decisiveness
7.14%
Distance from the result being known to the end of the game.
These figures were calculated over a single representative* game, and based on the measures of quality described in "Automatic Generation and Evaluation of Recombination Games" (Cameron Browne, 2007). (* Representative, in the sense that it is close to the mean game length.)
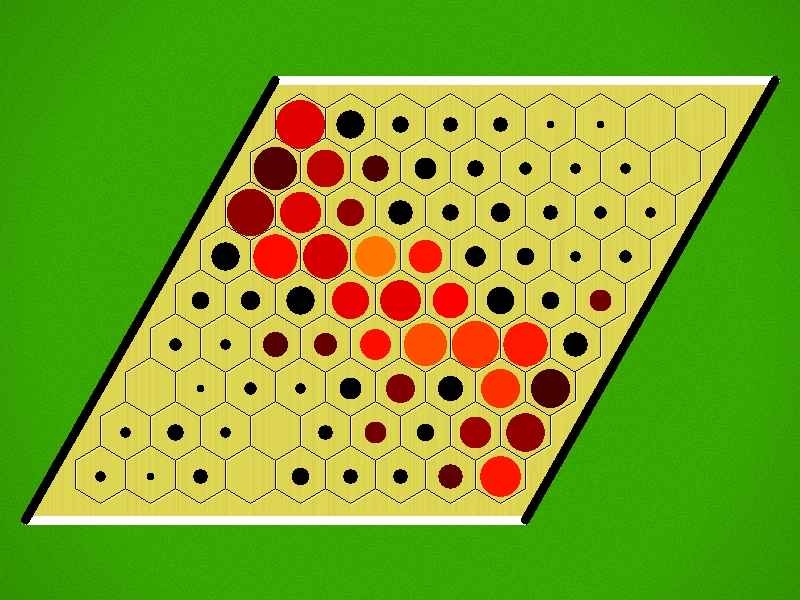
Swap Heatmap (Full Scan)
Colour shows the frequency of swaps on turn 2 if this move is played on turn 1; black < red < yellow < white.
Based on 100 trials/move at 0.1s thinking time each.
Openings
Moves
Animation
i3,f4,h1,h5,g4,g3,d6
h4,Swap,i1,f3,g4,e6,d5
c3,a9,d5,d8,e7,f5
i3,f4,h1,h5,g4,g3
c4,b7,a7,c9,d6,a8
h4,i1,f3,f2,e5,d5
h4,Swap,i1,f3,g4,e6
i3,h1,f4,g4,g2
h4,Swap,i1,f3,g4
c3,a9,d5,d8,e7
i3,f4,h1,h5,g4
c4,b7,a7,c9,d6
Opening Heatmap
Colour shows the success ratio of this play over the first 10moves; black < red < yellow < white.
Size shows the frequency this move is played.
Swap Heatmap (Historic)
Colour shows the frequency of swaps on turn 2 if this move is played on turn 1; black < red < yellow < white.
Size shows the frequency this move is played.
Unique Positions Reachable at Depth
0
1
2
3
4
5
6
7
1
81
6642
36190
140034
707282
4078550
27616836
Note: most games do not take board rotation and reflection into consideration. Multi-part turns could be treated as the same or different depth depending on the implementation. Counts to depth N include all moves reachable at lower depths. Inaccuracies may also exist due to hash collisions, but Ai Ai uses 64-bit hashes so these will be a very small fraction of a percentage point.
Shortest Game(s)
No solutions found to depth 7.
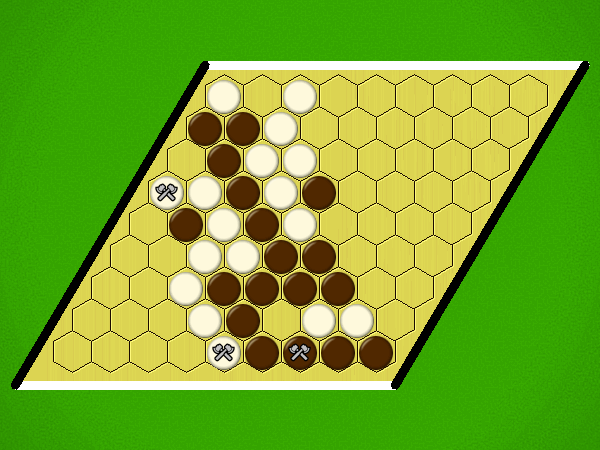
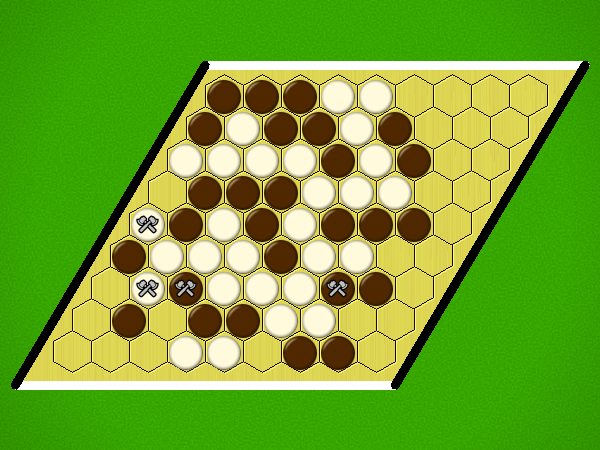
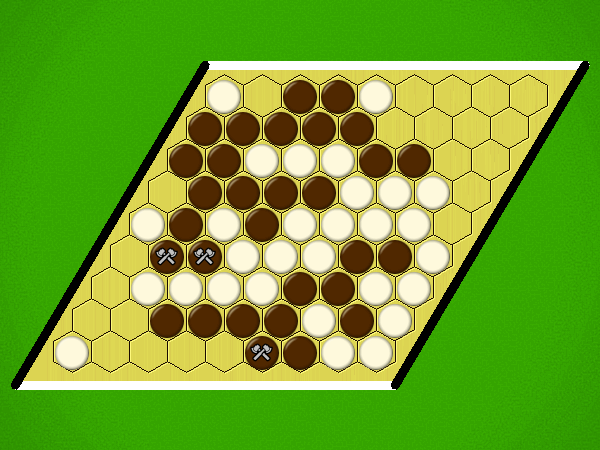
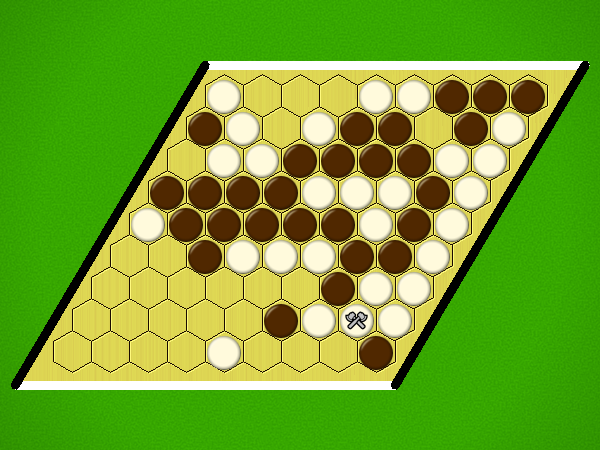
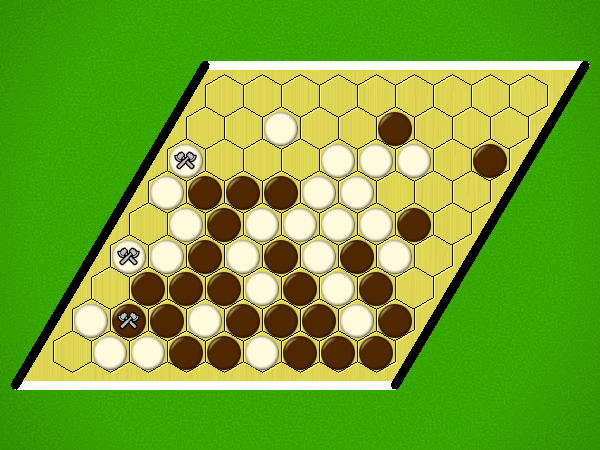
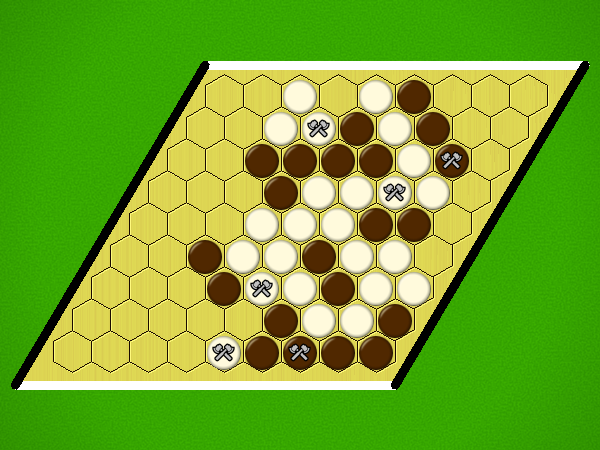
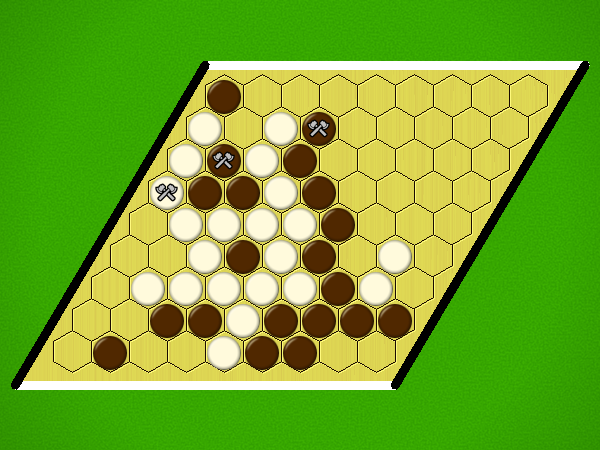
Puzzles
Puzzle
Solution
Player 2 (Black) to win in 8 moves
Player 2 (Black) to win in 10 moves
Player 1 (White) to win in 4 moves
Player 1 (White) to win in 8 moves
Player 2 (Black) to win in 6 moves
Player 2 (Black) to win in 6 moves
Player 1 (White) to win in 6 moves
Player 2 (Black) to win in 2 moves
Player 2 (Black) to win in 6 moves
Player 1 (White) to win in 2 moves
Player 1 (White) to win in 6 moves
Player 2(White) to win in 6 moves
Weak puzzle selection criteria are in place; the first move may not be unique.