Oli is a drawless connection game for two players: Black and White.
Generated at 2023-07-07, 13:25 from 1000 logged games.
Rules
Representative game (in the sense of being of mean length). Wherever you see the 'representative game' referred to in later sections, this is it!
Play
Black plays first, then turns alternate. On your turn, cover a 1×1, 1×2, 1×3 or 2×2 empty area of the board with stones of your color.
At the end of your turn, for any two diagonally adjacent stones of your color there must be another stone of your color adjacent to both, and there must be no 2×3 areas consisting of two empty points, two black stones a knight's jump away from each other and two white stones a knight's jump away from each other.
You win if there is a chain of orthogonally connected stones of your color touching the two opposite board edges of your color.
If you have no moves available on your turn, you must pass. Passing is otherwise not allowed. There will always be a move available to at least one of the players.
To make the game fair, White will have the option, on their first turn only, to swap sides with Black instead of making a regular move.
Ai Ai calculates the size of the implementation, and compares it to the Ai Ai implementation of the simplest possible game (which just fills the board). Note that this estimate may include some graphics and heuristics code as well as the game logic. See the wikipedia entry for more details.
Playout Complexity Estimate
Playouts per second
2866.31 (348.88µs/playout)
Reference Size
534730.76 (1.87µs/playout)
Ratio (low is good)
186.56
Tavener complexity: the heat generated by playing every possible instance of a game with a perfectly efficient programme. Since this is not possible to calculate, Ai Ai calculates the number of random playouts per second and compares it to the fastest non-trivial Ai Ai game (Connect 4). This ratio gives a practical indication of how complex the game is. Combine this with the computational state space, and you can get an idea of how strong the default (MCTS-based) AI will be.
State Space Complexity
% new positions/bucket
State Space Complexity
382285984
State Space Complexity bounds
34786138 < 382285984 < ∞
State Space Complexity (log 10)
8.58
State Space Complexity bounds (log 10)
7.54 <= 8.58 <= ∞
Samples
1001436
Confidence
0.00
0: totally unreliable, 100: perfect
State space complexity (where present) is an estimate of the number of distinct game tree reachable through actual play. Over a series of random games, Ai Ai checks each position to see if it is new, or a repeat of a previous position and keeps a total for each game. As the number of games increase, the quantity of new positions seen per game decreases. These games are then partitioned into a number of buckets, and if certain conditions are met, Ai Ai treats the number in each bucket as the start of a strictly decreasing geometric sequence and sums it to estimate the total state space. The accuracy is calculated as 1-[end bucket count]/[starting bucklet count]
Playout/Search Speed
Label
Its/s
SD
Nodes/s
SD
Game length
SD
Random playout
4,041
9
86,934
316
22
5
search.UCT
5,279
955
21
5
Random: 10 second warmup for the hotspot compiler. 100 trials of 1000ms each.
Other: 100 playouts, means calculated over the first 5 moves only to avoid distortion due to speedup at end of game.
Mirroring Strategies
Rotation (Half turn) lost each game as expected.
Reflection (X axis) lost each game as expected.
Reflection (Y axis) lost each game as expected.
Copy last move lost each game as expected.
Mirroring strategies attempt to copy the previous move. On first move, they will attempt to play in the centre. If neither of these are possible, they will pick a random move. Each entry represents a different form of copying; direct copy, reflection in either the X or Y axis, half-turn rotation.
Win % By Player (Bias)
1: Player 1 (Black) win %
55.80±3.09
Includes draws = 50%
2: Player 2 (white) win %
44.20±3.05
Includes draws = 50%
Draw %
0.00
Percentage of games where all players draw.
Decisive %
100.00
Percentage of games with a single winner.
Samples
1000
Quantity of logged games played
Note: that win/loss statistics may vary depending on thinking time (horizon effect, etc.), bad heuristics, bugs, and other factors, so should be taken with a pinch of salt. (Given perfect play, any game of pure skill will always end in the same result.)
Note: Ai Ai differentiates between states where all players draw or win or lose; this is mostly to support cooperative games.
UCT Skill Chains
Match
AI
Strong Wins
Draws
Strong Losses
#Games
Strong Score
p1 Win%
Draw%
p2 Win%
Game Length
0
Random
60
UCT (its=61)
524
0
476
1000
0.4930 <= 0.5240 <= 0.5548
53.00
0.00
47.00
21.18
61
UCT (its=61)
484
0
516
1000
0.4531 <= 0.4840 <= 0.5150
53.80
0.00
46.20
20.73
Search for levels ended: time limit reached.
Level of Play: Strong beats Weak 60% of the time (lower bound with 95% confidence).
Draw%, p1 win% and game length may give some indication of trends as AI strength increases.
1st Player Win Ratios by Playing Strength
This chart shows the win(green)/draw(black)/loss(red) percentages, as UCT play strength increases. Note that for most games, the top playing strength show here will be distinctly below human standard.
Complexity
Game length
13.09
Branching factor
123.59
Complexity
10^26.13
Based on game length and branching factor
Computational Complexity
10^6.67
Sample quality (100 best): 7.79
Samples
1000
Quantity of logged games played
Computational complexity (where present) is an estimate of the game tree reachable through actual play. For each game in turn, Ai Ai marks the positions reached in a hashtable, then counts the number of new moves added to the table. Once all moves are applied, it treats this sequence as a geometric progression and calculates the sum as n-> infinity.
Move Classification
Board Size
49
Quantity of distinct board cells
Distinct actions
240
Quantity of distinct moves (e.g. "e4") regardless of position in game tree
Good moves
126
A good move is selected by the AI more than the average
Bad moves
114
A bad move is selected by the AI less than the average
Response distance%
38.02%
Distance from move to response / maximum board distance; a low value suggests a game is tactical rather than strategic.
Samples
1000
Quantity of logged games played
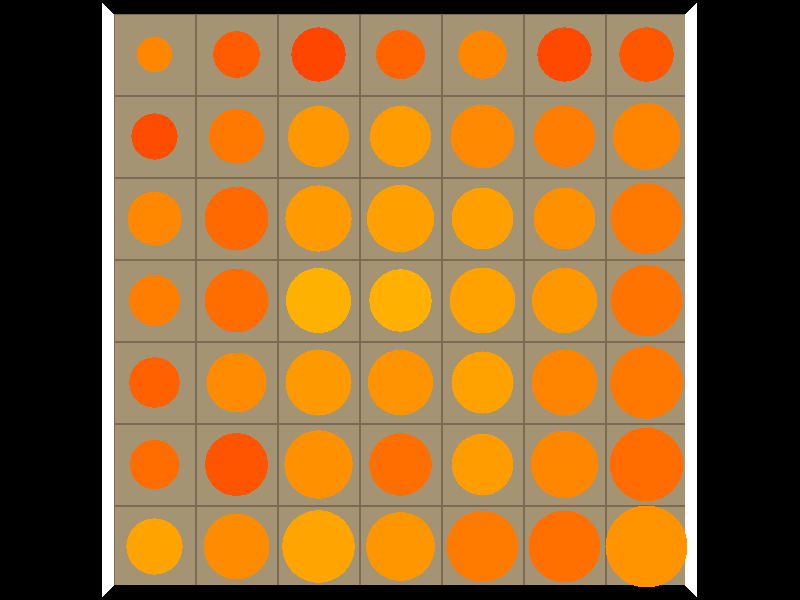
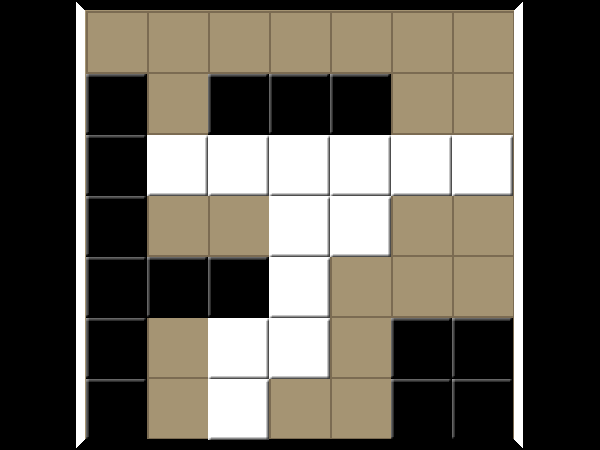
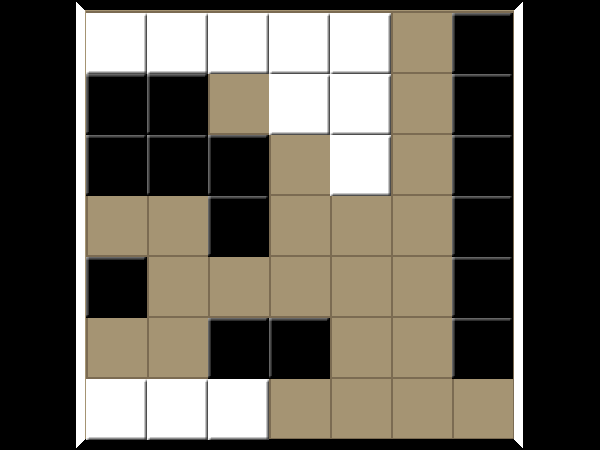
Board Coverage
A mean of 47.25% of board locations were used per game.
Colour and size show the frequency of visits.
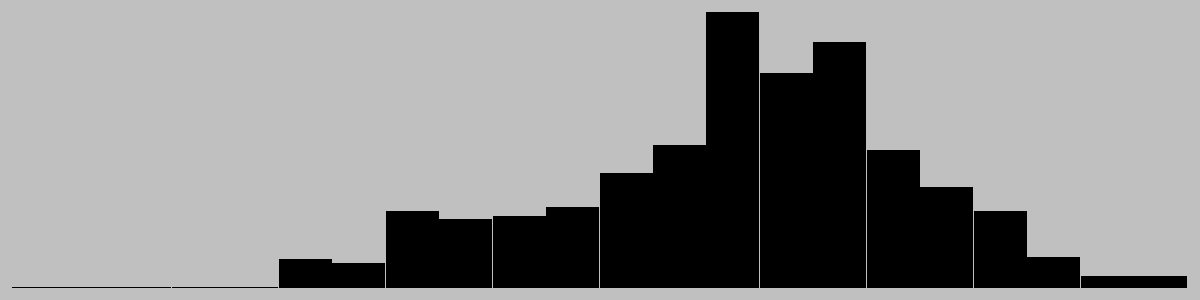
Game Length
Game length frequencies.
Mean
13.09
Mode
[13]
Median
13.0
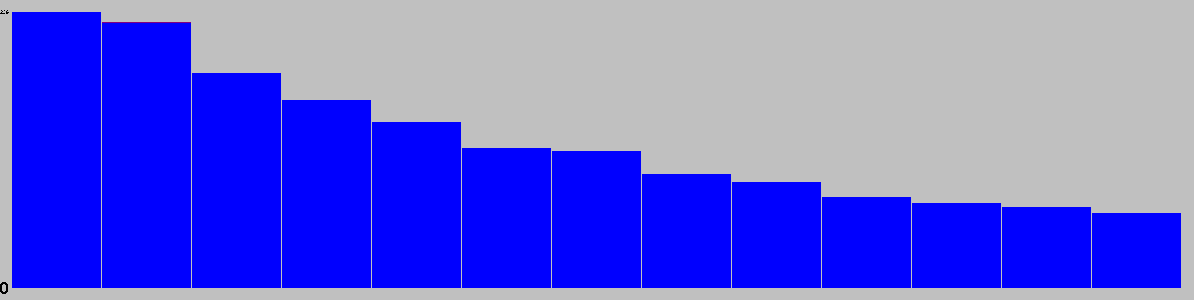
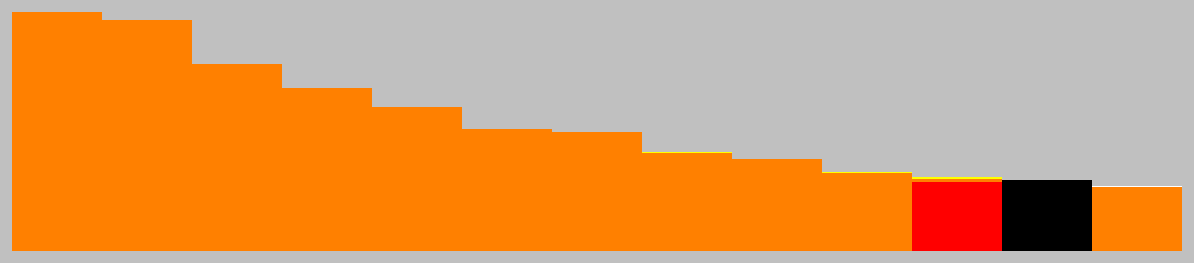
Change in Material Per Turn
Mean change in material/round
1.86
Complete round of play (all players)
This chart is based on a single representative* playout, and gives a feel for the change in material over the course of a game. (* Representative in the sense that it is close to the mean length.)
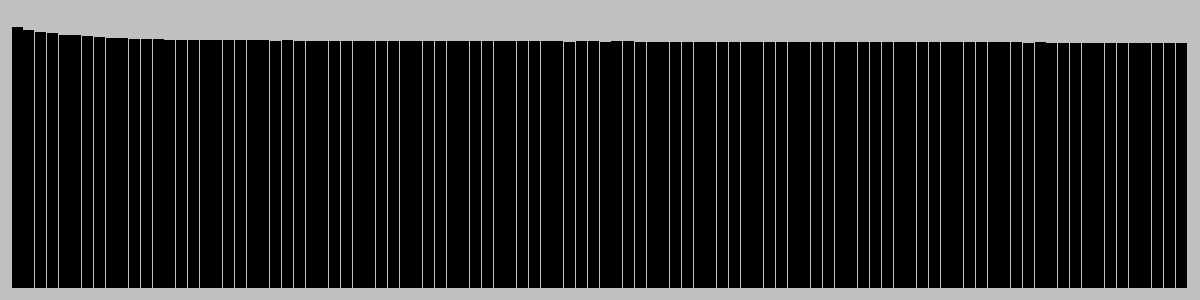
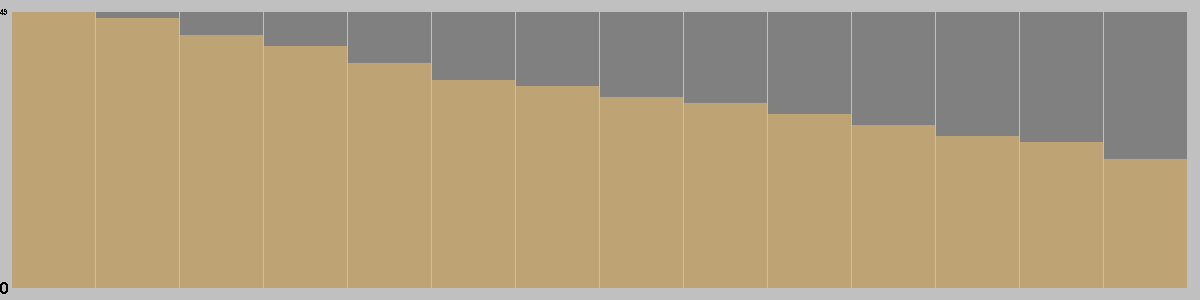
Actions/turn
Table: branching factor per turn, based on a single representative* game. (* Representative in the sense that it is close to the mean game length.)
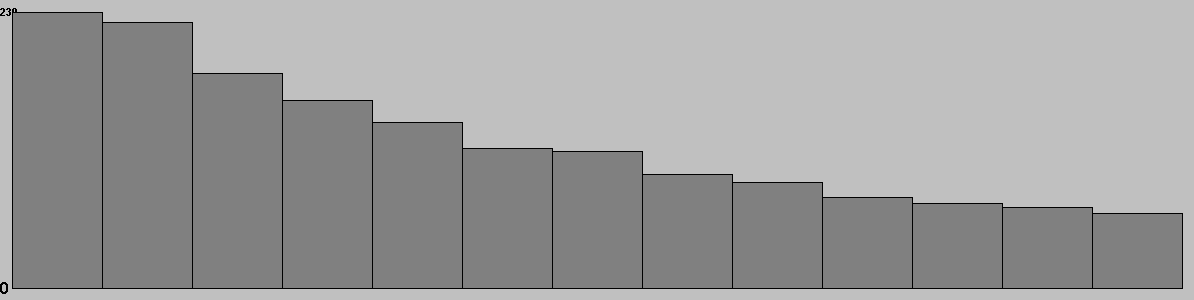
Action Types per Turn
This chart is based on a single representative* game, and gives a feel for the types of moves available throughout that game. (* Representative in the sense that it is close to the mean game length.)
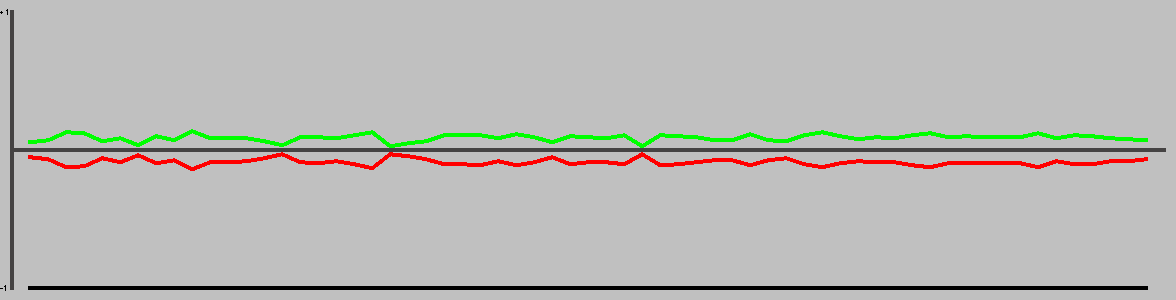
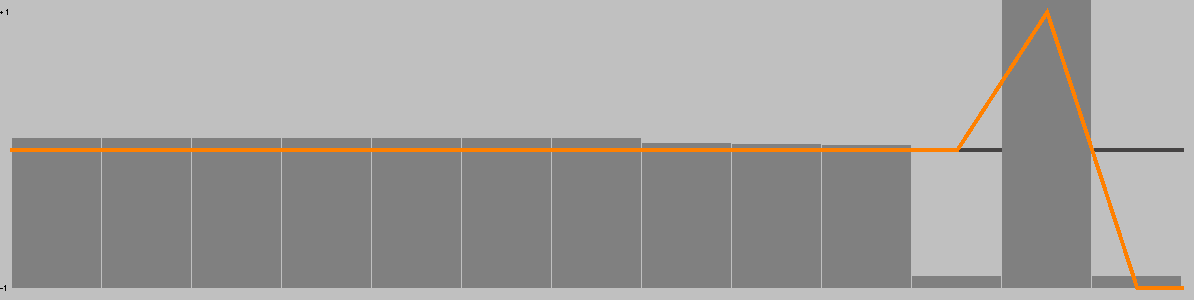
This chart shows the best move value with respect to the active player; the orange line represents the value of doing nothing (null move).
The lead changed on 23% of the game turns. Ai Ai found 3 critical turns (turns with only one good option).
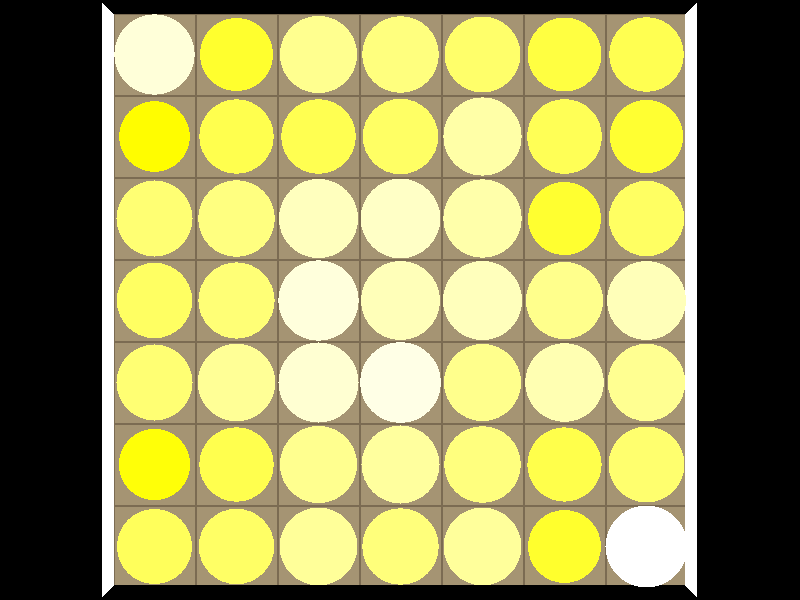
Position Heatmap
This chart shows the relative temperature of all moves each turn. Colour range: black (worst), red, orange(even), yellow, white(best).
Good/Effective moves
Measure
All players
Player 1
Player 2
Mean % of effective moves
84.94
72.03
100.00
Mean no. of effective moves
119.15
112.00
127.50
Effective game space
10^23.56
10^11.15
10^12.41
Mean % of good moves
0.50
0.61
0.38
Mean no. of good moves
0.38
0.43
0.33
Good move game space
10^0.30
10^0.30
10^0.00
These figures were calculated over a single game.
An effective move is one with score 0.1 of the best move (including the best move). -1 (loss) <= score <= 1 (win)
A good move has a score > 0. Note that when there are no good moves, an multiplier of 1 is used for the game space calculation.
Quality Measures
Measure
Value
Description
Hot turns
38.46%
A hot turn is one where making a move is better than doing nothing.
Momentum
15.38%
% of turns where a player improved their score.
Correction
0.00%
% of turns where the score headed back towards equality.
Depth
4.31%
Difference in evaluation between a short and long search.
Drama
0.00%
How much the winner was behind before their final victory.
Foulup Factor
15.38%
Moves that looked better than the best move after a short search.
Surprising turns
0.00%
Turns that looked bad after a short search, but good after a long one.
Last lead change
84.62%
Distance through game when the lead changed for the last time.
Decisiveness
23.08%
Distance from the result being known to the end of the game.
These figures were calculated over a single representative* game, and based on the measures of quality described in "Automatic Generation and Evaluation of Recombination Games" (Cameron Browne, 2007). (* Representative, in the sense that it is close to the mean game length.)
Swap Heatmap (Full Scan)
Colour shows the frequency of swaps on turn 2 if this move is played on turn 1; black < red < yellow < white.
Based on 100 trials/move at 0.1s thinking time each.
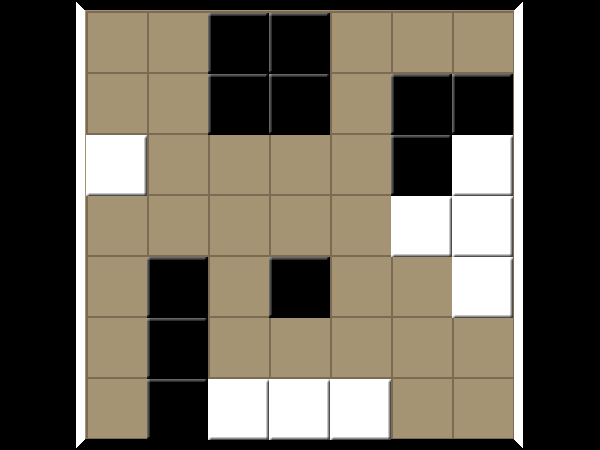
Opening Heatmap
Colour shows the success ratio of this play over the first 10moves; black < red < yellow < white.
Size shows the frequency this move is played.
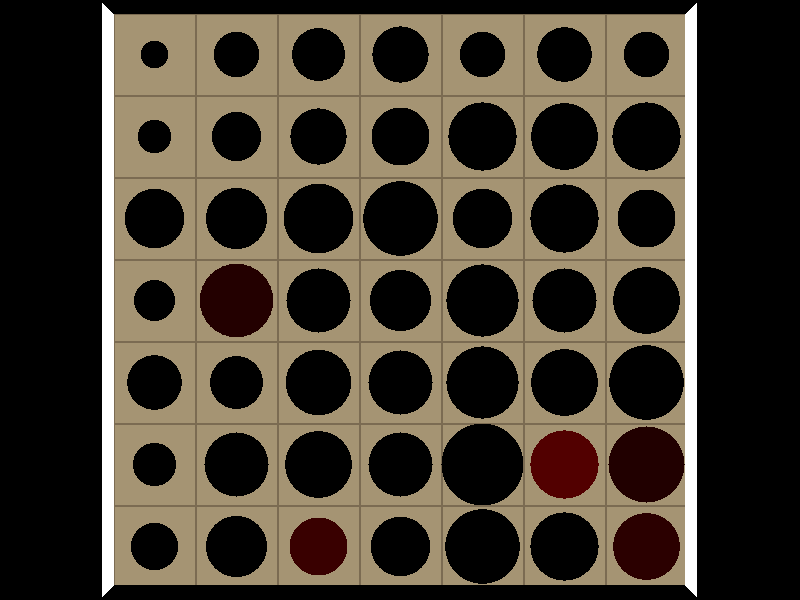
Swap Heatmap (Historic)
Colour shows the frequency of swaps on turn 2 if this move is played on turn 1; black < red < yellow < white.
Size shows the frequency this move is played.
Unique Positions Reachable at Depth
0
1
2
1
239
52166
Note: most games do not take board rotation and reflection into consideration. Multi-part turns could be treated as the same or different depth depending on the implementation. Counts to depth N include all moves reachable at lower depths. Inaccuracies may also exist due to hash collisions, but Ai Ai uses 64-bit hashes so these will be a very small fraction of a percentage point.
Shortest Game(s)
No solutions found to depth 2.
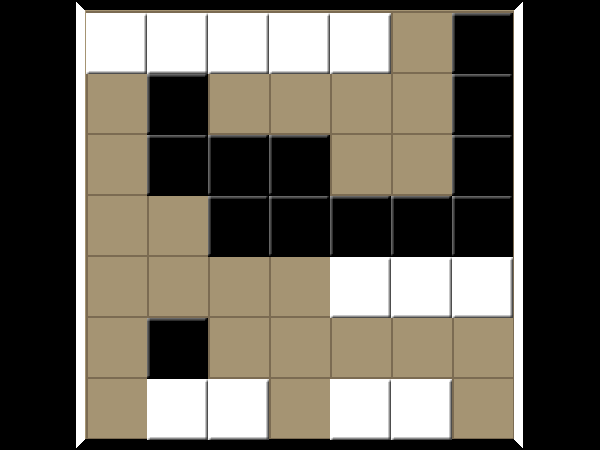
Puzzles
Puzzle
Solution
Player 1 (Black) to win in 5 moves
Player 2 (white) to win in 5 moves
Player 2 (white) to win in 3 moves
Player 1 (Black) to win in 3 moves
Player 2 (white) to win in 3 moves
Player 1 (Black) to win in 3 moves
Player 2 (white) to win in 3 moves
Player 2 (white) to win in 3 moves
Player 2 (white) to win in 3 moves
Player 2 (white) to win in 3 moves
Player 2 (white) to win in 3 moves
Player 2 (white) to win in 3 moves
Selection criteria: first move must be unique, and not forced to avoid losing. Beyond that, Puzzles will be rated by the product of [total move]/[best moves] at each step, and the best puzzles selected.