A connection game with a difference; time travel has been invented, and you can go back in time to fix past mistakes.
Generated at 29/07/2021, 22:53 from 1000 logged games.
Rules
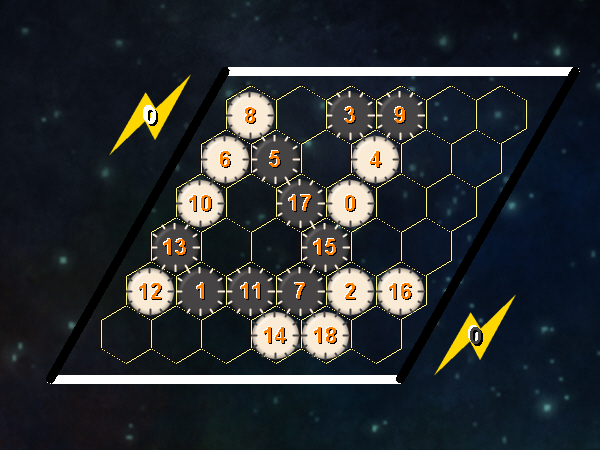
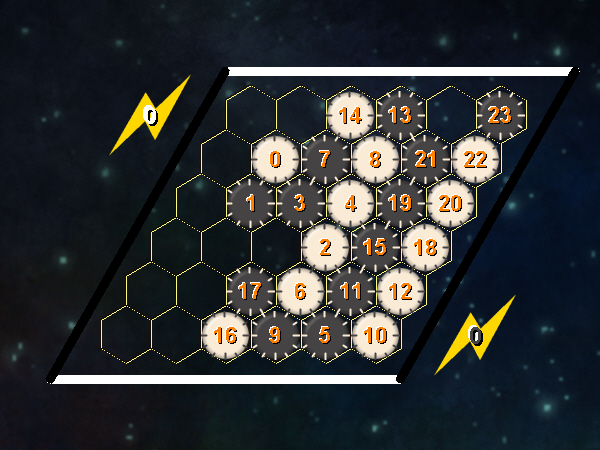
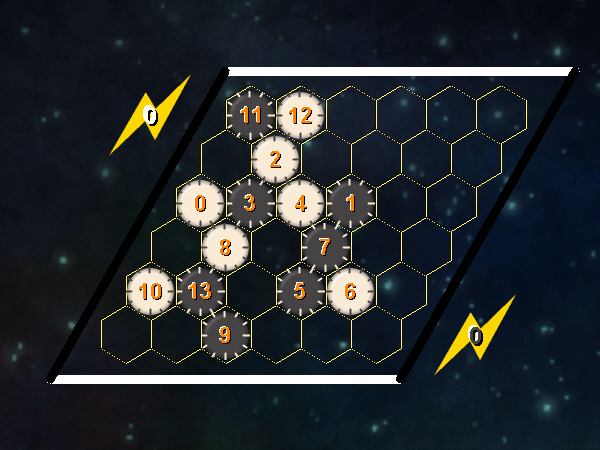
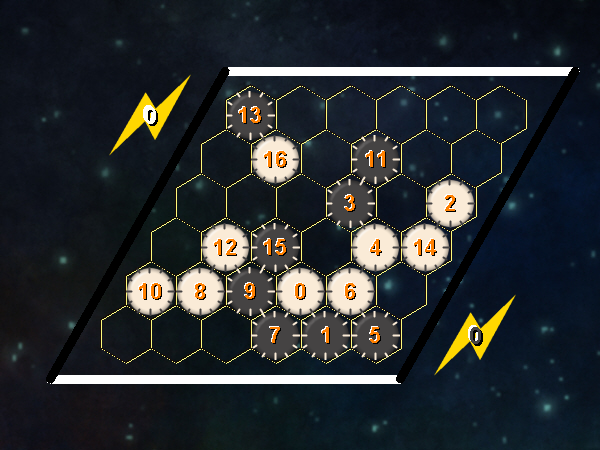
Representative game (in the sense of being of mean length). Wherever you see the 'representative game' referred to in later sections, this is it!
Overview
This is a hex variant, but the same concept can be applied to many games where pieces are placed but never move. Instead of a standard piece, players take turns adding a numbered piece to the board; the number counts up from 0, and can be thought of as the tick of the clock on which the piece was added. By using temporal energy, players can then go back in time and move the pieces. A simple shift to an unoccupied space costs 1 energy; for a higher cost, a piece with a low number can also move to a space with a higher numbered piece; because it hasn't been placed yet.This causes a paradox, resulting in the later piece - and all subsequent pieces - being removed, and play resuming from the last legal move.
Play
Definition: the current era (CE) is the lowest token not on the board.
The owner of the piece with value equal to the CE is the next player to move.
Each turn, the active player performs at least one of the following actions:
Move: place a piece with number equal to the CE in an empty space (the number is the age of the piece). A move always ends your turn.
Time slip: move a piece on the board to an empty adjacent space. Spend 1 unit of temporal energy. A time slip never ends your turn.
Paradox: move a piece on the board to an adjacent occupied space, with a higher age. Remove the captured piece and all higher numbers from the board and give them back to their respective players. Pay temporal energy equal to the distance moved + [age of displaced piece]-[age of moving piece]. Note that the next player to move will depend on the colour of the piece displaced.
Pass: a player may only pass when they have no legal moves.
GOAL
Win by having an unbroken path between your two sides of the board at the start of your turn.
Ai Ai calculates the size of the implementation, and compares it to the Ai Ai implementation of the simplest possible game (which just fills the board). Note that this estimate may include some graphics and heuristics code as well as the game logic. See the wikipedia entry for more details.
Playout Complexity Estimate
Playouts per second
19982.30 (50.04µs/playout)
Reference Size
792016.47 (1.26µs/playout)
Ratio (low is good)
39.64
Tavener complexity: the heat generated by playing every possible instance of a game with a perfectly efficient programme. Since this is not possible to calculate, Ai Ai calculates the number of random playouts per second and compares it to the fastest non-trivial Ai Ai game (Connect 4). This ratio gives a practical indication of how complex the game is. Combine this with the computational state space, and you can get an idea of how strong the default (MCTS-based) AI will be.
Playout/Search Speed
Label
Its/s
SD
Nodes/s
SD
Game length
SD
Random playout
25,760
557
1,413,613
30,782
55
8
search.UCT
347,030
22,236
47
10
Random: 10 second warmup for the hotspot compiler. 100 trials of 1000ms each.
Other: 100 playouts, means calculated over the first 5 moves only to avoid distortion due to speedup at end of game.
Mirroring Strategies
Rotation (Half turn) lost each game as expected.
Reflection (X axis) lost each game as expected.
Reflection (Y axis) lost each game as expected.
Copy last move lost each game as expected.
Mirroring strategies attempt to copy the previous move. On first move, they will attempt to play in the centre. If neither of these are possible, they will pick a random move. Each entry represents a different form of copying; direct copy, reflection in either the X or Y axis, half-turn rotation.
Win % By Player (Bias)
1: White win %
39.80±2.99
Includes draws = 50%
2: Black win %
60.20±3.07
Includes draws = 50%
Draw %
0.00
Percentage of games where all players draw.
Decisive %
100.00
Percentage of games with a single winner.
Samples
1000
Quantity of logged games played
Note: that win/loss statistics may vary depending on thinking time (horizon effect, etc.), bad heuristics, bugs, and other factors, so should be taken with a pinch of salt. (Given perfect play, any game of pure skill will always end in the same result.)
Note: Ai Ai differentiates between states where all players draw or win or lose; this is mostly to support cooperative games.
UCT Skill Chains
Match
AI
Strong Wins
Draws
Strong Losses
#Games
Strong Score
p1 Win%
Draw%
p2 Win%
Game Length
0
Random
1
UCT (its=2)
631
0
292
923
0.6529 <= 0.6836 <= 0.7128
54.06
0.00
45.94
54.24
5
UCT (its=6)
631
0
287
918
0.6566 <= 0.6874 <= 0.7165
54.25
0.00
45.75
53.50
11
UCT (its=12)
631
0
367
998
0.6019 <= 0.6323 <= 0.6616
57.52
0.00
42.48
54.04
16
UCT (its=17)
631
0
356
987
0.6089 <= 0.6393 <= 0.6687
57.65
0.00
42.35
53.89
23
UCT (its=24)
631
0
361
992
0.6057 <= 0.6361 <= 0.6655
55.54
0.00
44.46
53.23
32
UCT (its=33)
631
0
335
966
0.6226 <= 0.6532 <= 0.6826
56.73
0.00
43.27
52.67
36
UCT (its=98)
631
0
99
730
0.8376 <= 0.8644 <= 0.8873
51.23
0.00
48.77
54.81
37
UCT (its=266)
631
0
67
698
0.8799 <= 0.9040 <= 0.9237
52.72
0.00
47.28
57.04
38
UCT (its=723)
631
0
59
690
0.8913 <= 0.9145 <= 0.9331
48.12
0.00
51.88
51.59
39
UCT (its=1966)
631
0
156
787
0.7725 <= 0.8018 <= 0.8281
47.14
0.00
52.86
47.25
40
UCT (its=5343)
631
0
239
870
0.6947 <= 0.7253 <= 0.7539
50.34
0.00
49.66
45.17
42
UCT (its=39479)
339
0
89
428
0.7511 <= 0.7921 <= 0.8278
60.05
0.00
39.95
43.78
43
UCT (its=39479)
499
0
501
1000
0.4681 <= 0.4990 <= 0.5299
89.30
0.00
10.70
49.15
Search for levels ended. Close to theoretical value: player 1 wins.
Level of Play: Strong beats Weak 60% of the time (lower bound with 95% confidence).
Draw%, p1 win% and game length may give some indication of trends as AI strength increases.
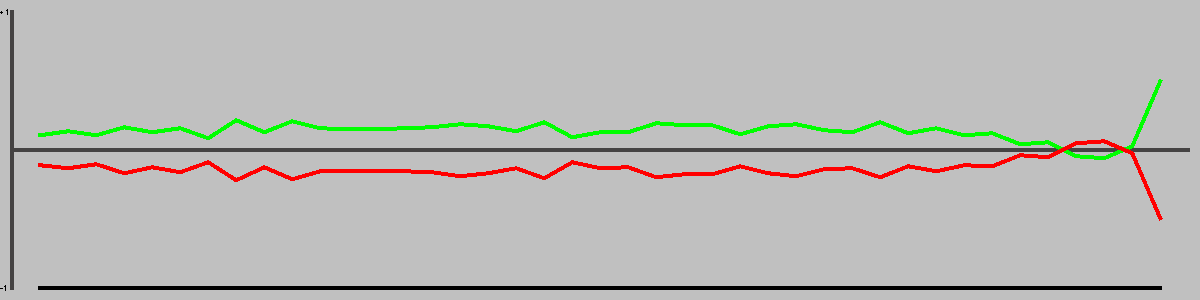
1st Player Win Ratios by Playing Strength
This chart shows the win(green)/draw(black)/loss(red) percentages, as UCT play strength increases. Note that for most games, the top playing strength show here will be distinctly below human standard.
Complexity
Game length
42.48
Branching factor
39.85
Complexity
10^67.47
Based on game length and branching factor
Samples
1000
Quantity of logged games played
Computational complexity (where present) is an estimate of the game tree reachable through actual play. For each game in turn, Ai Ai marks the positions reached in a hashtable, then counts the number of new moves added to the table. Once all moves are applied, it treats this sequence as a geometric progression and calculates the sum as n-> infinity.
Move Classification
Distinct actions
206
Number of distinct moves (e.g. "e4") regardless of position in game tree
Good moves
108
A good move is selected by the AI more than the average
Bad moves
98
A bad move is selected by the AI less than the average
Response distance
2.18
Mean distance between move and response; a low value relative to the board size may mean a game is tactical rather than strategic.
Samples
1000
Quantity of logged games played
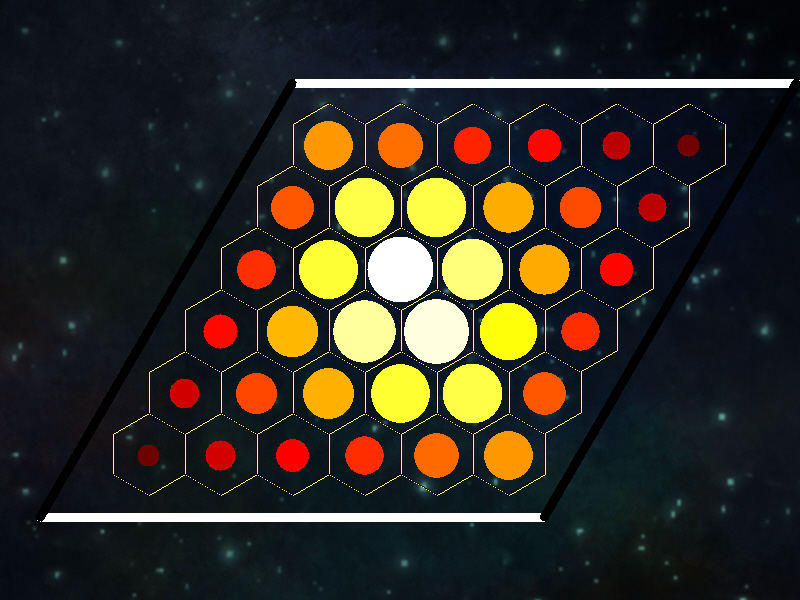
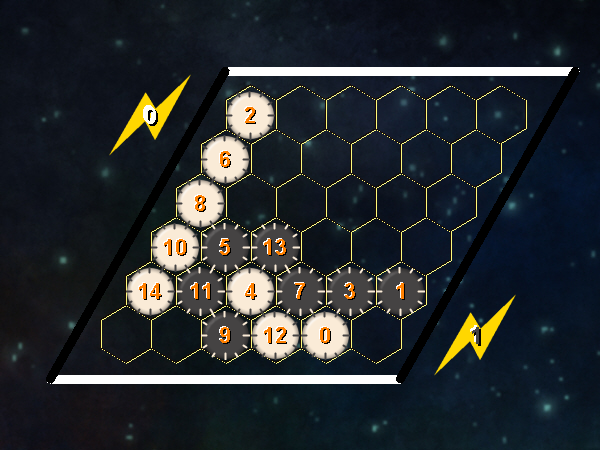
Board Coverage
A mean of 68.02% of board locations were used per game.
Colour and size show the frequency of visits.
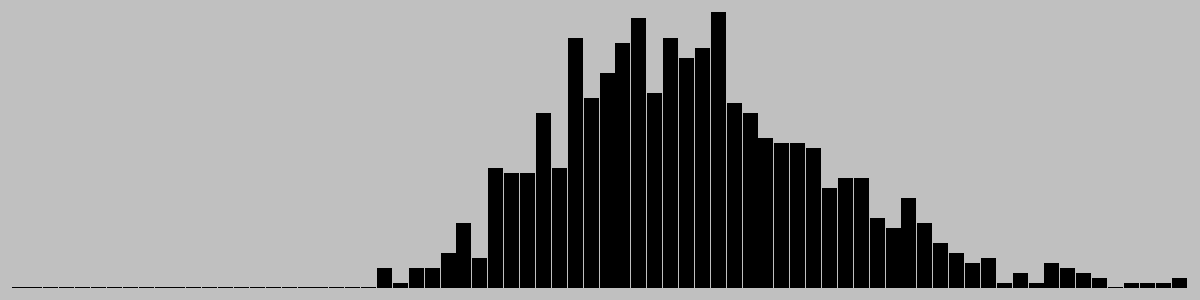
Game Length
Game length frequencies.
Mean
42.48
Mode
[44]
Median
42.0
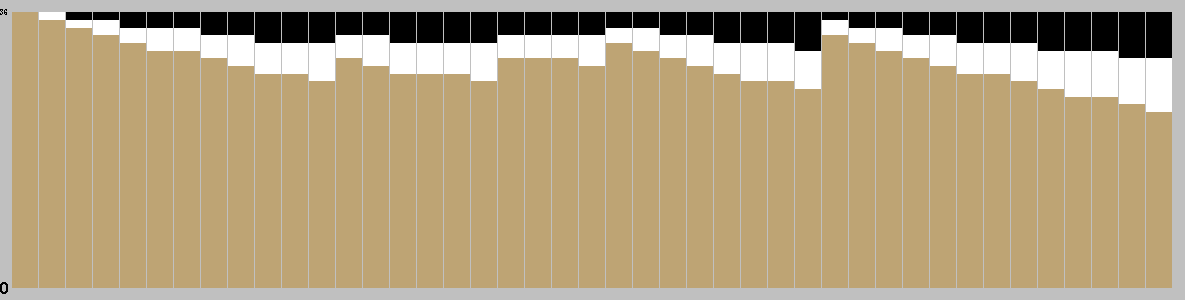
Change in Material Per Turn
This chart is based on a single representative* playout, and gives a feel for the change in material over the course of a game. (* Representative in the sense that it is close to the mean length.)
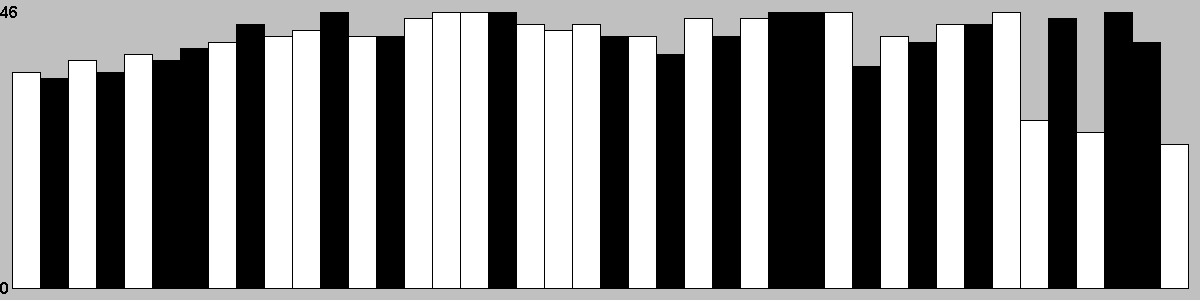
Actions/turn
Table: branching factor per turn, based on a single representative* game. (* Representative in the sense that it is close to the mean game length.)
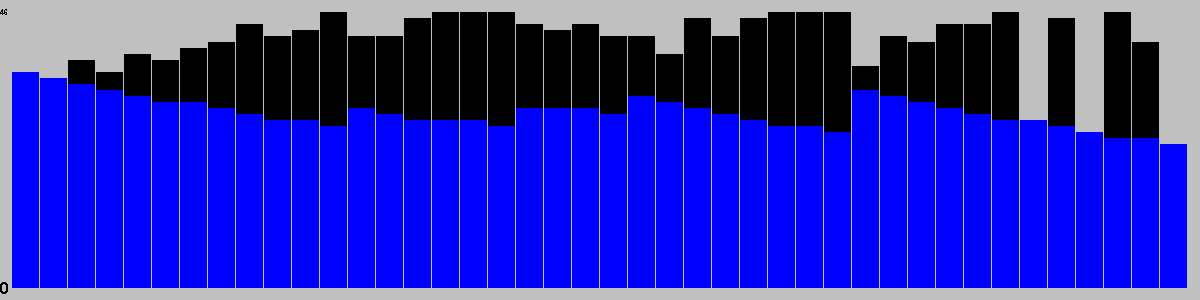
Action Types per Turn
This chart is based on a single representative* game, and gives a feel for the types of moves available throughout that game. (* Representative in the sense that it is close to the mean game length.)
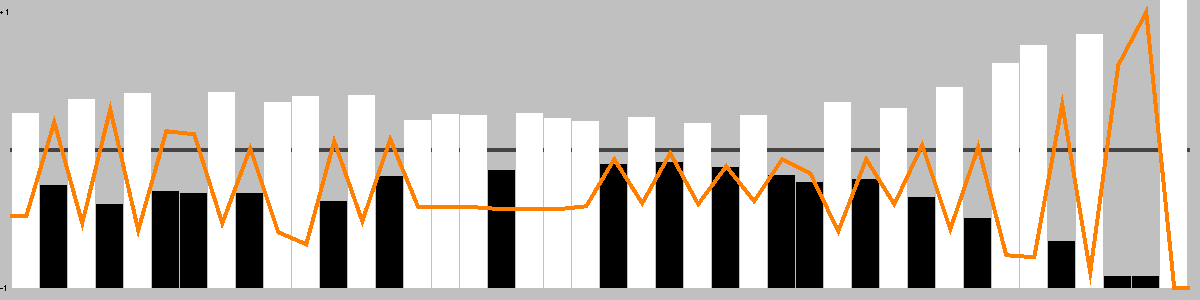
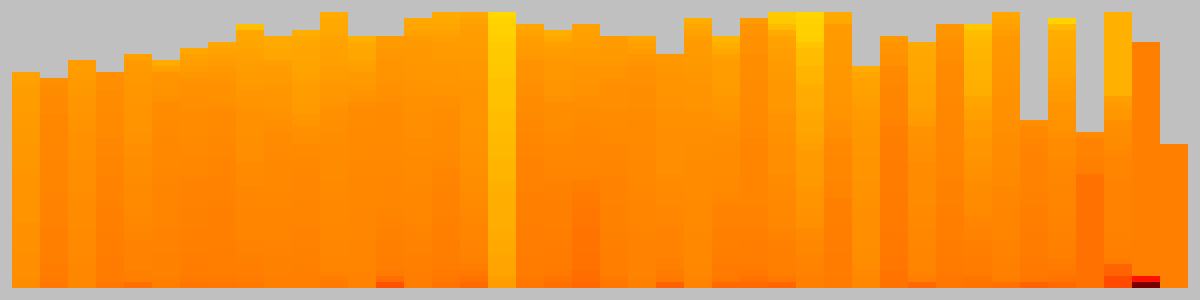
This chart shows the best move value with respect to the active player; the orange line represents the value of doing nothing (null move).
The first player never had the advantage. The lead changed on 0% of the game turns. Ai Ai found 0 critical turns (turns with only one good option).
Position Heatmap
This chart shows the relative temperature of all moves each turn. Colour range: black (worst), red, orange(even), yellow, white(best).
Good/Effective moves
Measure
All players
Player 1
Player 2
Mean % of effective moves
25.77
27.38
23.83
Mean no. of effective moves
10.19
10.48
9.84
Effective game space
10^38.78
10^21.81
10^16.97
Mean % of good moves
38.59
0.00
85.31
Mean no. of good moves
16.07
0.00
35.53
Good move game space
10^29.18
10^0.00
10^29.18
These figures were calculated over a single game.
An effective move is one with score 0.1 of the best move (including the best move). -1 (loss) <= score <= 1 (win)
A good move has a score > 0. Note that when there are no good moves, an multiplier of 1 is used for the game space calculation.
Quality Measures
Measure
Value
Description
Hot turns
95.24%
A hot turn is one where making a move is better than doing nothing.
Momentum
26.19%
% of turns where a player improved their score.
Correction
30.95%
% of turns where the score headed back towards equality.
Depth
1.83%
Difference in evaluation between a short and long search.
Drama
0.00%
How much the winner was behind before their final victory.
Foulup Factor
59.52%
Moves that looked better than the best move after a short search.
Surprising turns
0.00%
Turns that looked bad after a short search, but good after a long one.
Last lead change
-2.38%
Distance through game when the lead changed for the last time.
Decisiveness
7.14%
Distance from the result being known to the end of the game.
These figures were calculated over a single representative* game, and based on the measures of quality described in "Automatic Generation and Evaluation of Recombination Games" (Cameron Browne, 2007). (* Representative, in the sense that it is close to the mean game length.)
Openings
Moves
Animation
d2,a2,c5
f2,f3,b4
e1,d1,e1-d2
f1,e5,f1-f2
e2,e5,e2-f2
e3,a5,e3-d4
f2,e2,d1
a6,b1,a6-b6
b6,d4,a1
c6,b1,c6-b6
c6,c4,c6-d6
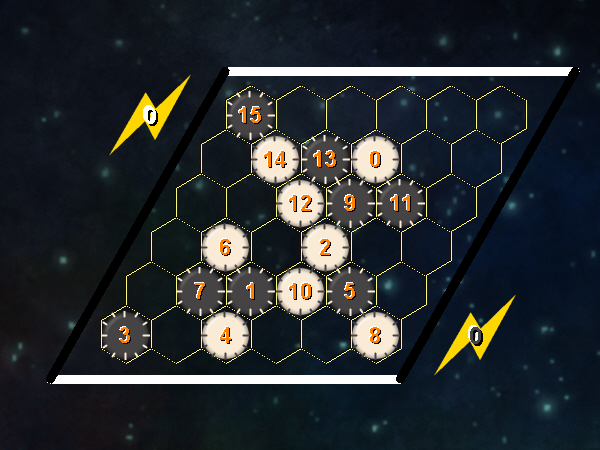
Opening Heatmap
Colour shows the success ratio of this play over the first 10moves; black < red < yellow < white.
Size shows the frequency this move is played.
Unique Positions Reachable at Depth
0
1
2
3
4
1
36
1296
45432
1547384
Note: most games do not take board rotation and reflection into consideration. Multi-part turns could be treated as the same or different depth depending on the implementation. Counts to depth N include all moves reachable at lower depths. Inaccuracies may also exist due to hash collisions, but Ai Ai uses 64-bit hashes so these will be a very small fraction of a percentage point.
Shortest Game(s)
No solutions found to depth 4.
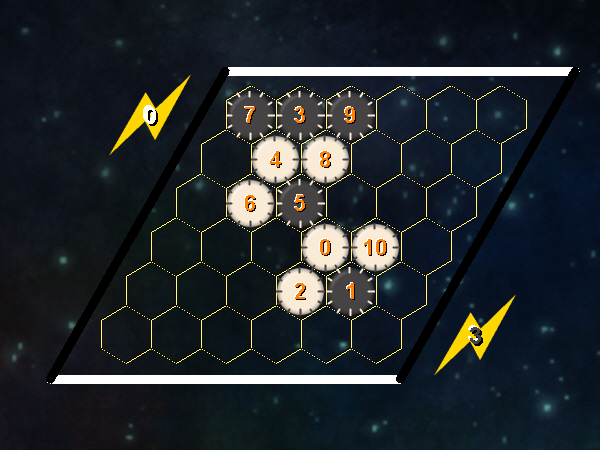
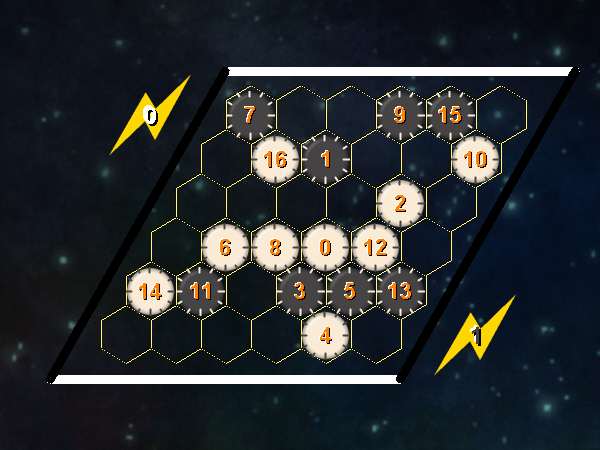
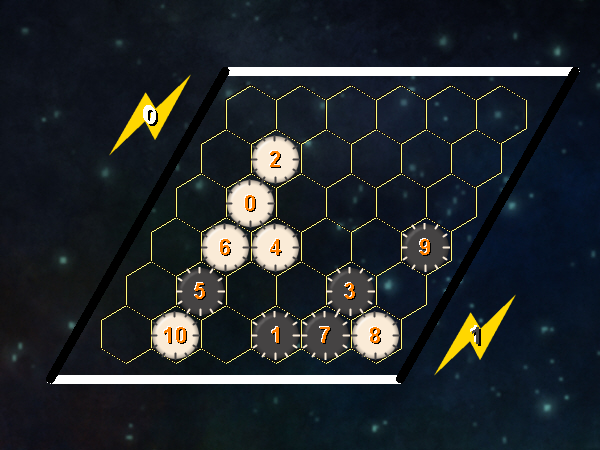
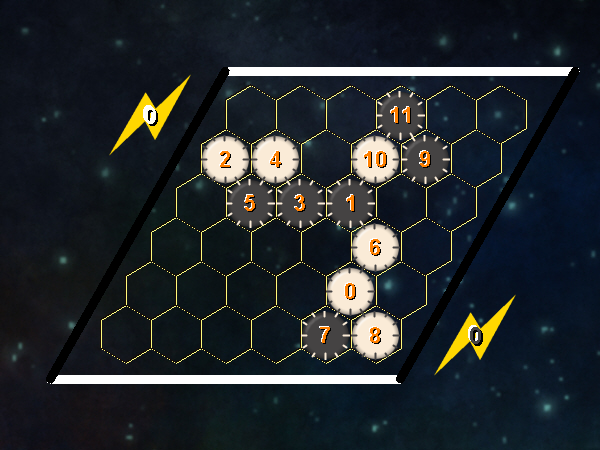
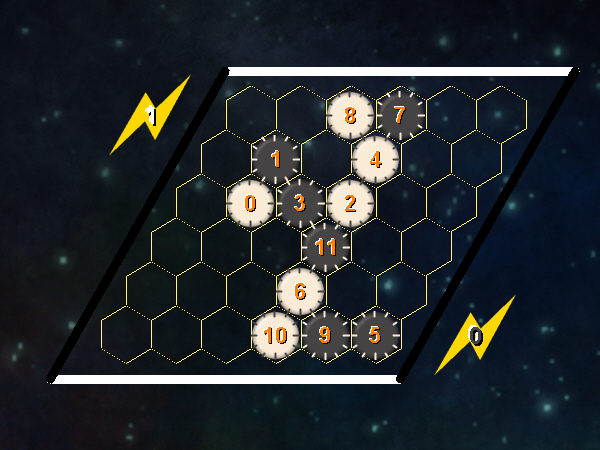
Puzzles
Puzzle
Solution
Black to win in 6 moves
Black to win in 3 moves
White to win in 4 moves
Black to win in 7 moves
Black to win in 8 moves
Black to win in 5 moves
White to win in 2 moves
White to win in 6 moves
White to win in 6 moves
White to win in 6 moves
Black to win in 6 moves
White to win in 5 moves
Weak puzzle selection criteria are in place; the first move may not be unique.