Full Report for Permute by Eric Silverman

Full Report for Permute by Eric Silverman

Permute is a game about twisting things, inspired by twisty puzzles like the Rubik's Cube. The name comes from one of the two main things we can do with pieces in a twisty puzzle: permute them (shuffle their positions); or orient them (change their facing). In this game players take it in turns to rotate 2x2 sets of pieces ('faces') on the board, in an attempt to bring pieces of their colour together in larger groups. Once a face has been twisted, part of it is locked in place ('bandaged') and can't be twisted again. When no more twists are possible, the game is over and the players' largest groups of pieces are scored. To win the game, you must permute your pieces so that they form the largest connected group, and deny your opponent the chance to do the same!

Generated at 29/10/2020, 10:08 from 37903 logged games.

Rules

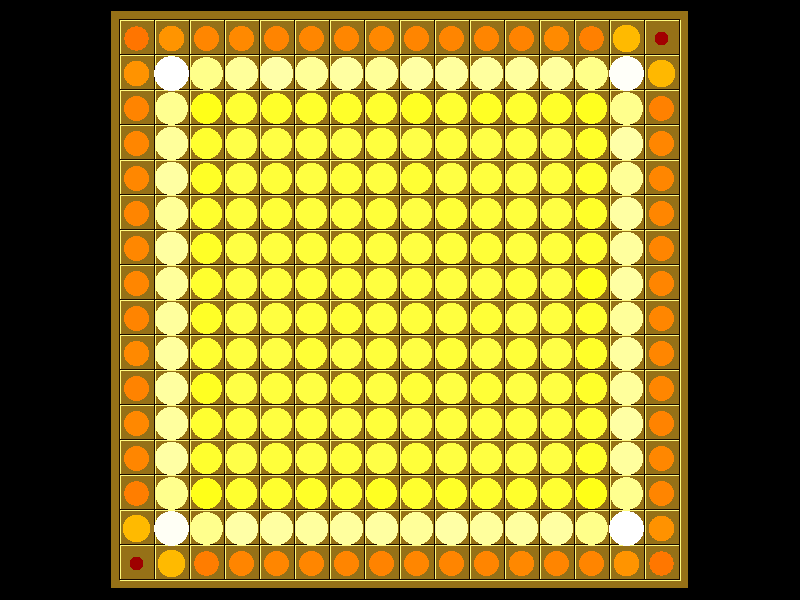
Representative game (in the sense of being of mean length). Wherever you see the 'representative game' referred to in later sections, this is it!

Play

Each turn, take the following steps:

Twist
Drag from top left to bottom right to rotate a square clockwise, or from bottom right to top left to rotate anticlockwise.
Bandage
Click on a piece in the square you just rotated to bandage it.

Goal

The game ends when there are no more legal moves. The player who controls the biggest group (defined by orthogonal connectivity of like-coloured pawns) is the winner. If the two biggest groups are equal in size, the second-biggest groups are compared, and so on.

Miscellaneous

General comments:

Play: Combinatorial

Family: Combinatorial 2020,Minimal

Mechanism(s): No Board,Scoring

Level: Standard

BGG Stats

BGG EntryPermute
BGG Ratingnull
#Votersnull
SDnull
BGG Weightnull
#Votersnull
Yearnull

Kolomogorov Complexity Analysis

Size (bytes)28370
Reference Size10293
Ratio2.76

Ai Ai calculates the size of the implementation, and compares it to the Ai Ai implementation of the simplest possible game (which just fills the board). Note that this estimate may include some graphics and heuristics code as well as the game logic. See the wikipedia entry for more details.

Playout Complexity Estimate

Playouts per second3976.28 (251.49µs/playout)
Reference Size1552795.03 (0.64µs/playout)
Ratio (low is good)390.51

Tavener complexity: the heat generated by playing every possible instance of a game with a perfectly efficient programme. Since this is not possible to calculate, Ai Ai calculates the number of random playouts per second and compares it to the fastest non-trivial Ai Ai game (Connect 4). This ratio gives a practical indication of how complex the game is. Combine this with the computational state space, and you can get an idea of how strong the default (MCTS-based) AI will be.

Playout/Search Speed

LabelIts/sSDNodes/sSDGame lengthSD
Random playout3,99229746,6065,4211877
search.UCB4,106591827
search.UCT4,097691817

Random: 10 second warmup for the hotspot compiler. 100 trials of 1000ms each.

Other: 100 playouts, means calculated over the first 5 moves only to avoid distortion due to speedup at end of game.

Mirroring Strategies

Rotation (Half turn) lost each game as expected.
Reflection (X axis) lost each game as expected.
Reflection (Y axis) lost each game as expected.
Copy last move lost each game as expected.

Mirroring strategies attempt to copy the previous move. On first move, they will attempt to play in the centre. If neither of these are possible, they will pick a random move. Each entry represents a different form of copying; direct copy, reflection in either the X or Y axis, half-turn rotation.

Win % By Player (Bias)

1: Orange win %50.01±0.50Includes draws = 50%
2: Yellow win %49.99±0.50Includes draws = 50%
Draw %0.00Percentage of games where all players draw.
Decisive %100.00Percentage of games with a single winner.
Samples37903Quantity of logged games played

Note: that win/loss statistics may vary depending on thinking time (horizon effect, etc.), bad heuristics, bugs, and other factors, so should be taken with a pinch of salt. (Given perfect play, any game of pure skill will always end in the same result.)

Note: Ai Ai differentiates between states where all players draw or win or lose; this is mostly to support cooperative games.

UCT Skill Chains

MatchAIStrong WinsDrawsStrong Losses#GamesStrong Scorep1 Win%Draw%p2 Win%Game Length
0Random         
1UCT (its=2)63103139440.6378 <= 0.6684 <= 0.697746.930.0053.07187.06
4UCT (its=5)63103669970.6025 <= 0.6329 <= 0.662351.760.0048.24186.57
13UCT (its=14)63103599900.6069 <= 0.6374 <= 0.666749.090.0050.91186.50
19
UCT (its=20)
571
0
429
1000
0.5401 <= 0.5710 <= 0.6013
49.50
0.00
50.50
186.49
20
UCT (its=20)
494
0
506
1000
0.4631 <= 0.4940 <= 0.5250
49.20
0.00
50.80
185.96

Search for levels ended: time limit reached.

Level of Play: Strong beats Weak 60% of the time (lower bound with 95% confidence).

Draw%, p1 win% and game length may give some indication of trends as AI strength increases.

1st Player Win Ratios by Playing Strength

This chart shows the win(green)/draw(black)/loss(red) percentages, as UCT play strength increases. Note that for most games, the top playing strength show here will be distinctly below human standard.

Complexity

Game length186.55 
Branching factor92.10 
Complexity10^218.00Based on game length and branching factor
Samples37903Quantity of logged games played

Computational complexity (where present) is an estimate of the game tree reachable through actual play. For each game in turn, Ai Ai marks the positions reached in a hashtable, then counts the number of new moves added to the table. Once all moves are applied, it treats this sequence as a geometric progression and calculates the sum as n-> infinity.

Move Classification

Distinct actions708Number of distinct moves (e.g. "e4") regardless of position in game tree
Good moves256A good move is selected by the AI more than the average
Bad moves451A bad move is selected by the AI less than the average
Response distance4.00Mean distance between move and response; a low value relative to the board size may mean a game is tactical rather than strategic.
Samples37903Quantity of logged games played

Board Coverage

A mean of 74.82% of board locations were used per game.

Colour and size show the frequency of visits.

Game Length

Game length frequencies.

Mean186.55
Mode[187]
Median187.0

Change in Material Per Turn

This chart is based on a single representative* playout, and gives a feel for the change in material over the course of a game. (* Representative in the sense that it is close to the mean length.)

Actions/turn

Table: branching factor per turn, based on a single representative* game. (* Representative in the sense that it is close to the mean game length.)

Action Types per Turn

This chart is based on a single representative* game, and gives a feel for the types of moves available throughout that game. (* Representative in the sense that it is close to the mean game length.)

Red: removal, Black: move, Blue: Add, Grey: pass, Purple: swap sides, Brown: other.

Trajectory

This chart shows the best move value with respect to the active player; the orange line represents the value of doing nothing (null move).

The lead changed on 12% of the game turns. Ai Ai found 10 critical turns (turns with only one good option).

Position Heatmap

This chart shows the relative temperature of all moves each turn. Colour range: black (worst), red, orange(even), yellow, white(best).

Good/Effective moves

MeasureAll playersPlayer 1Player 2
Mean % of effective moves26.4523.8029.13
Mean no. of effective moves12.1711.8912.45
Effective game space10^113.2710^55.6810^57.59
Mean % of good moves34.7066.033.04
Mean no. of good moves46.7480.8312.29
Good move game space10^112.9310^98.1110^14.82

These figures were calculated over a single game.

An effective move is one with score 0.1 of the best move (including the best move). -1 (loss) <= score <= 1 (win)

A good move has a score > 0. Note that when there are no good moves, an multiplier of 1 is used for the game space calculation.

Quality Measures

MeasureValueDescription
Hot turns62.57%A hot turn is one where making a move is better than doing nothing.
Momentum22.46%% of turns where a player improved their score.
Correction45.99%% of turns where the score headed back towards equality.
Depth7.69%Difference in evaluation between a short and long search.
Drama0.98%How much the winner was behind before their final victory.
Foulup Factor37.43%Moves that looked better than the best move after a short search.
Surprising turns2.67%Turns that looked bad after a short search, but good after a long one.
Last lead change89.84%Distance through game when the lead changed for the last time.
Decisiveness4.28%Distance from the result being known to the end of the game.

These figures were calculated over a single representative* game, and based on the measures of quality described in "Automatic Generation and Evaluation of Recombination Games" (Cameron Browne, 2007). (* Representative, in the sense that it is close to the mean game length.)

Openings

MovesAnimation
Widdershins h6-g7,Bandage g7,Widdershins o5-n6,Bandage n5,Widdershins h15-g16,Bandage h16
Widdershins h6-g7,Bandage g7,Widdershins o5-n6,Bandage n5,Clockwise g16-h15,Bandage h16
Widdershins h6-g7,Bandage g7,Clockwise n6-o5,Bandage n5,Widdershins h15-g16,Bandage h16
Widdershins h6-g7,Bandage g7,Clockwise n6-o5,Bandage n5,Clockwise g16-h15,Bandage h16
Widdershins m13-l14,Bandage l14,Widdershins m4-l5,Bandage l5,Widdershins f14-e15,Bandage f14
Widdershins m13-l14,Bandage l14,Widdershins m4-l5,Bandage l5,Clockwise e15-f14,Bandage f14
Widdershins m13-l14,Bandage l14,Clockwise l5-m4,Bandage l5,Widdershins f14-e15,Bandage f14
Widdershins m13-l14,Bandage l14,Clockwise l5-m4,Bandage l5,Clockwise e15-f14,Bandage f14
Clockwise g7-h6,Bandage g7,Widdershins o5-n6,Bandage n5,Widdershins h15-g16,Bandage h16
Clockwise g7-h6,Bandage g7,Widdershins o5-n6,Bandage n5,Clockwise g16-h15,Bandage h16
Clockwise g7-h6,Bandage g7,Clockwise n6-o5,Bandage n5,Widdershins h15-g16,Bandage h16
Clockwise g7-h6,Bandage g7,Clockwise n6-o5,Bandage n5,Clockwise g16-h15,Bandage h16

Opening Heatmap

Colour shows the success ratio of this play over the first 10moves; black < red < yellow < white.

Size shows the frequency this move is played.

Unique Positions Reachable at Depth

01234
1225675102709408245

Note: most games do not take board rotation and reflection into consideration.
Multi-part turns could be treated as the same or different depth depending on the implementation.
Counts to depth N include all moves reachable at lower depths.
Inaccuracies may also exist due to hash collisions, but Ai Ai uses 64-bit hashes so these will be a very small fraction of a percentage point.

Shortest Game(s)

No solutions found to depth 4.