The Tix family of games have common rules, but different piece mixes. The objective is to deprive your opponent of moves by deactivating their active pieces.
Generated at 29/10/2020, 19:37 from 22807 logged games.
Rules
Representative game (in the sense of being of mean length). Wherever you see the 'representative game' referred to in later sections, this is it!
Disclaimer
The full rules are long and complex. I suggest reading the rules at the Nestorgames web site if you are not fully familiar with them.
Definitions
Active
An active piece can move.
If you have at least one active piece on the board, you can add pieces.
After your first move, if you have no active pieces at the start of your turn, you lose.
Visually, an active piece is rotated diagonally so its corners are outside the board squares.
Inactive
An inactive piece cannot move.
Visually, an inactive piece is aligned with the board squares.
Play
The following actions are available at the start of a turn:
Add
Add a piece to the board; after your first move you can only do this if you already have at least one active piece. The piece must physically fit on the board without overlapping another piece.
Slide
Slide an active piece orthogonally; it may inactivate pieces that it passes, and may end in an inactive state. If the sliding piece ends in an inactive state, you get a bonus move.
Bonus moves:
Add
Add a piece to the board.
Remove
Remove a piece from the board.
Slide
As above. This can trigger another bonus action, and so on.
Activate
Rotate an inactive piece so it is active.
Pivot
Re-orient a Tixel or Regatta piece so it is visually different.
Variants
Bounded/Unbounded board
In Tix and Tixel (but not Regatta), the edge of the board is unbounded by default, meaning that pieces can protrude beyond the edge of the board. There is an option to play with the board bounded, making the edgesmore deadly; this is recommended only for board sizes 8 or larger.
Promotions
In Poka Yoke, the first two pieces you remove from the board are promoted from Tixel pieces to Regatta pieces.
Tix
Played only with Tix pieces (simple squares).
Tixel
Played only with Tixel pieces (one hollow edge).
Regatta
Played only with Regatta pieces (one hollow edge, one rounded corner). The board edge is bounded.
Poka Yoke
Played only with Tixel pieces (one hollow edge). Promotions are allowed.
I would enjoy this more, but I have a great deal of trouble visualising the moves :(
FiveStars
10
What I really like of his games is that you can start with Tix, then go on to Tixel then to Regatta increasing the challenge step by step.
Kolomogorov Complexity Analysis
Size (bytes)
39329
Reference Size
10293
Ratio
3.82
Ai Ai calculates the size of the implementation, and compares it to the Ai Ai implementation of the simplest possible game (which just fills the board). Note that this estimate may include some graphics and heuristics code as well as the game logic. See the wikipedia entry for more details.
Playout Complexity Estimate
Playouts per second
773.64 (1292.59µs/playout)
Reference Size
2070393.37 (0.48µs/playout)
Ratio (low is good)
2676.17
Tavener complexity: the heat generated by playing every possible instance of a game with a perfectly efficient programme. Since this is not possible to calculate, Ai Ai calculates the number of random playouts per second and compares it to the fastest non-trivial Ai Ai game (Connect 4). This ratio gives a practical indication of how complex the game is. Combine this with the computational state space, and you can get an idea of how strong the default (MCTS-based) AI will be.
Playout/Search Speed
Label
Its/s
SD
Nodes/s
SD
Game length
SD
Random playout
784
18
37,234
327
48
27
search.UCB
943
4,924
112
66
search.UCT
699
74
117
55
search.Minimax
35,574
14,781
63
59
search.AlphaBeta
8,472
3,006
85
78
Random: 10 second warmup for the hotspot compiler. 100 trials of 1000ms each.
Other: 100 playouts, means calculated over the first 5 moves only to avoid distortion due to speedup at end of game.
Mirroring Strategies
Rotation (Half turn) lost each game as expected.
Reflection (X axis) lost each game as expected.
Reflection (Y axis) lost each game as expected.
Copy last move lost each game as expected.
Mirroring strategies attempt to copy the previous move. On first move, they will attempt to play in the centre. If neither of these are possible, they will pick a random move. Each entry represents a different form of copying; direct copy, reflection in either the X or Y axis, half-turn rotation.
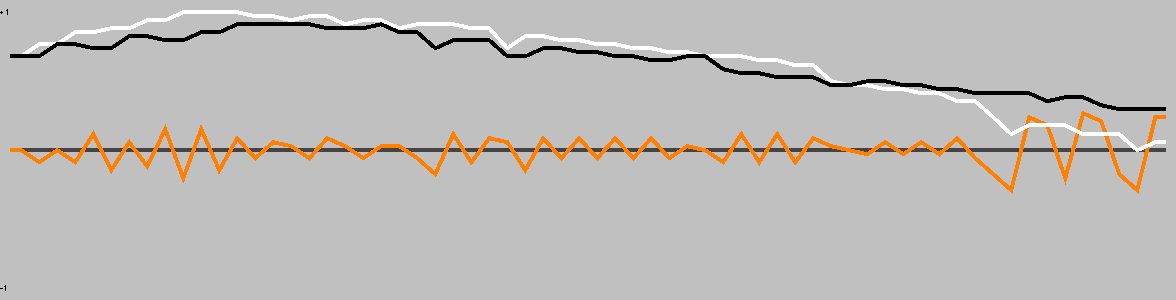
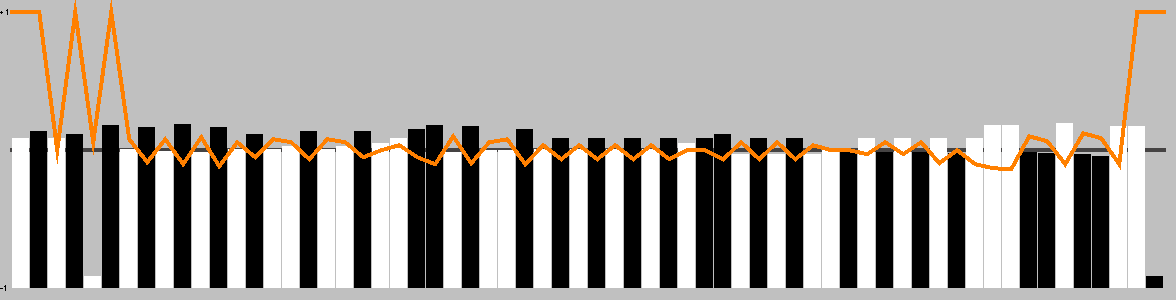
Heuristic Values
This chart shows the heuristic values thoughout a single representative* game. The orange line shows the difference between player scores. (* Representative, in the sense that it is close to the mean game length.)
Win % By Player (Bias)
1: White win %
51.38±0.65
Includes draws = 50%
2: Black win %
48.62±0.65
Includes draws = 50%
Draw %
0.02
Percentage of games where all players draw.
Decisive %
99.98
Percentage of games with a single winner.
Samples
22807
Quantity of logged games played
Note: that win/loss statistics may vary depending on thinking time (horizon effect, etc.), bad heuristics, bugs, and other factors, so should be taken with a pinch of salt. (Given perfect play, any game of pure skill will always end in the same result.)
Note: Ai Ai differentiates between states where all players draw or win or lose; this is mostly to support cooperative games.
UCT Skill Chains
Match
AI
Strong Wins
Draws
Strong Losses
#Games
Strong Score
p1 Win%
Draw%
p2 Win%
Game Length
0
Random
2
UCT (its=3)
631
0
244
875
0.6905 <= 0.7211 <= 0.7498
49.71
0.00
50.29
52.84
5
UCT (its=6)
631
0
369
1000
0.6006 <= 0.6310 <= 0.6604
51.10
0.00
48.90
62.21
11
UCT (its=12)
622
0
378
1000
0.5915 <= 0.6220 <= 0.6515
49.20
0.00
50.80
66.01
12
UCT (its=12)
518
2
480
1000
0.4880 <= 0.5190 <= 0.5498
50.30
0.20
49.50
69.78
Search for levels ended: time limit reached.
Level of Play: Strong beats Weak 60% of the time (lower bound with 95% confidence).
Draw%, p1 win% and game length may give some indication of trends as AI strength increases.
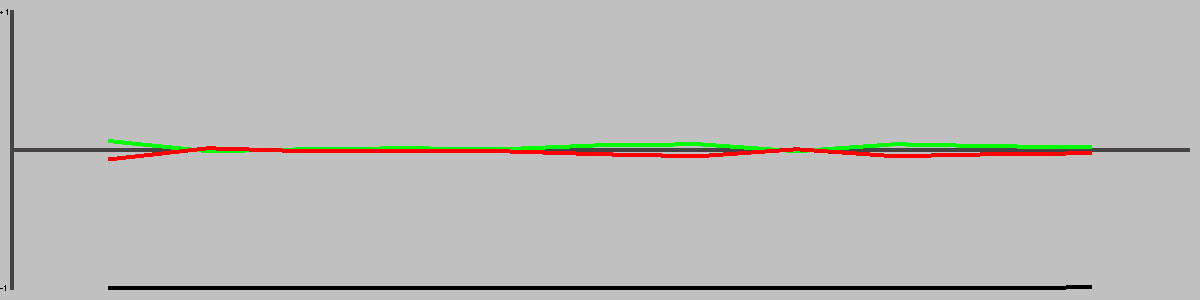
1st Player Win Ratios by Playing Strength
This chart shows the win(green)/draw(black)/loss(red) percentages, as UCT play strength increases. Note that for most games, the top playing strength show here will be distinctly below human standard.
Complexity
Game length
63.59
Branching factor
227.05
Complexity
10^139.49
Based on game length and branching factor
Samples
22807
Quantity of logged games played
Computational complexity (where present) is an estimate of the game tree reachable through actual play. For each game in turn, Ai Ai marks the positions reached in a hashtable, then counts the number of new moves added to the table. Once all moves are applied, it treats this sequence as a geometric progression and calculates the sum as n-> infinity.
Move Classification
Distinct actions
3451654
Number of distinct moves (e.g. "e4") regardless of position in game tree
Killer moves
8117
A 'killer' move is selected by the AI more than 50% of the time Too many killers to list.
Good moves
113873
A good move is selected by the AI more than the average
Bad moves
3337781
A bad move is selected by the AI less than the average
Terrible moves
3324319
A terrible move is never selected by the AI Too many terrible moves to list.
Response distance
5.20
Mean distance between move and response; a low value relative to the board size may mean a game is tactical rather than strategic.
Samples
22807
Quantity of logged games played
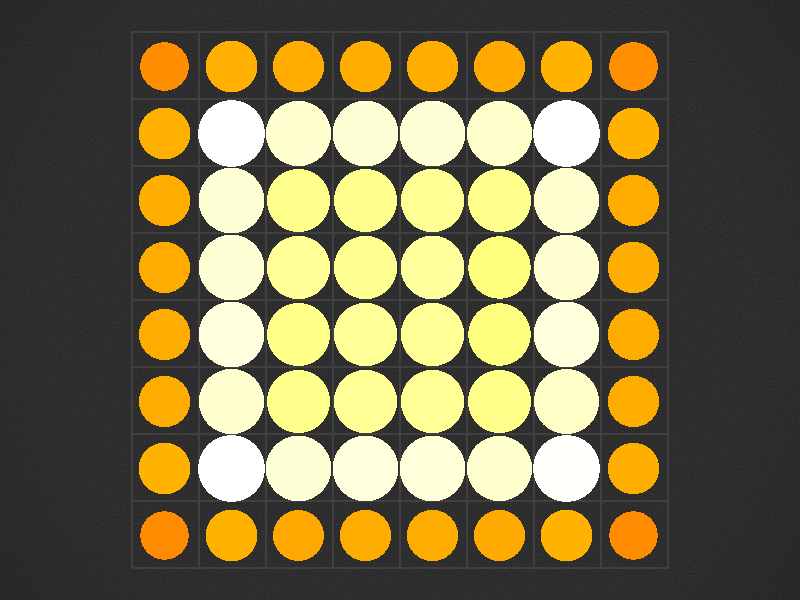
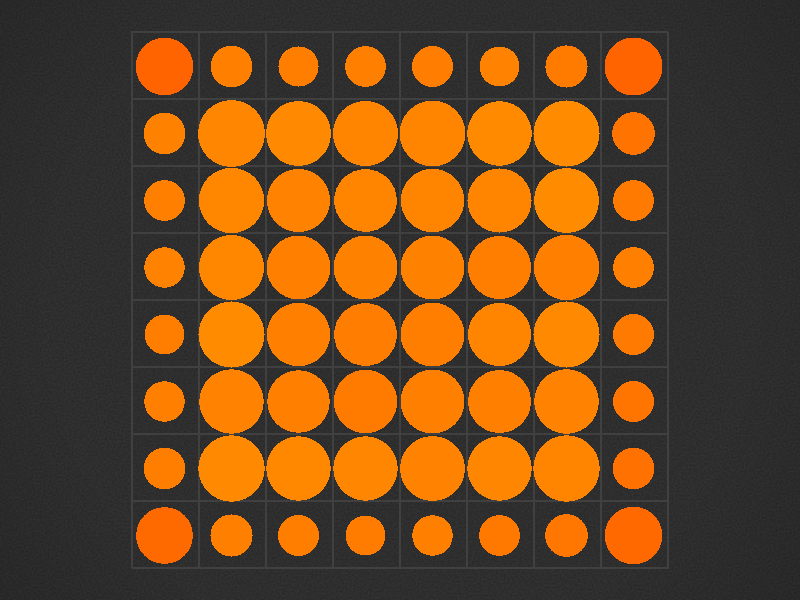
Board Coverage
A mean of 75.22% of board locations were used per game.
Colour and size show the frequency of visits.
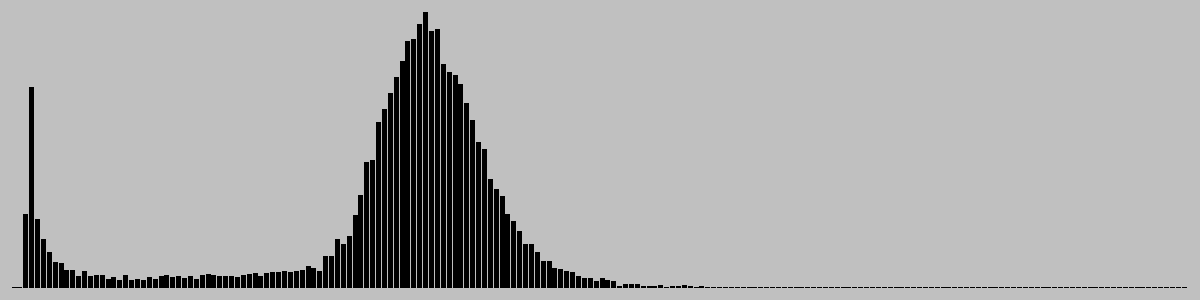
Game Length
Game length frequencies.
Mean
63.59
Mode
[70]
Median
69.0
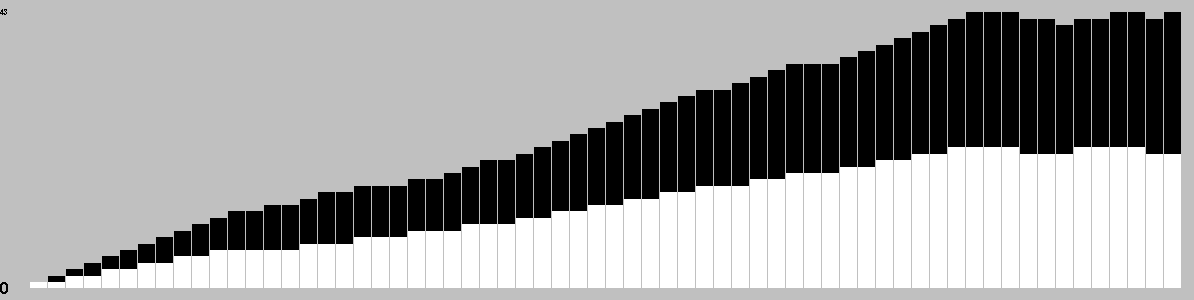
Change in Material Per Turn
This chart is based on a single representative* playout, and gives a feel for the change in material over the course of a game. (* Representative in the sense that it is close to the mean length.)
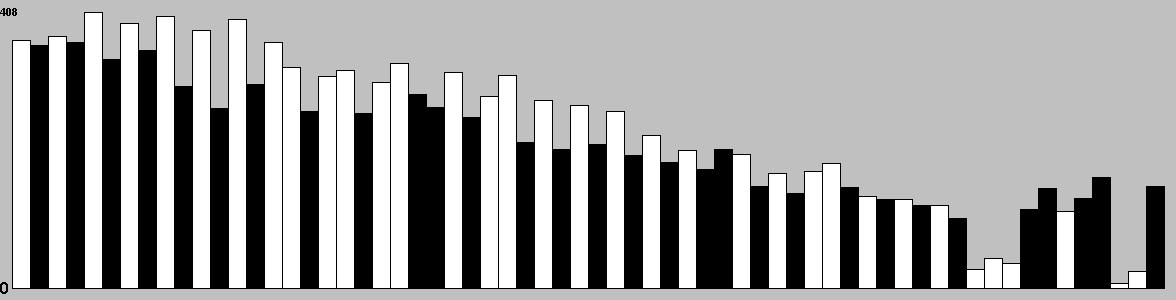
Actions/turn
Table: branching factor per turn, based on a single representative* game. (* Representative in the sense that it is close to the mean game length.)
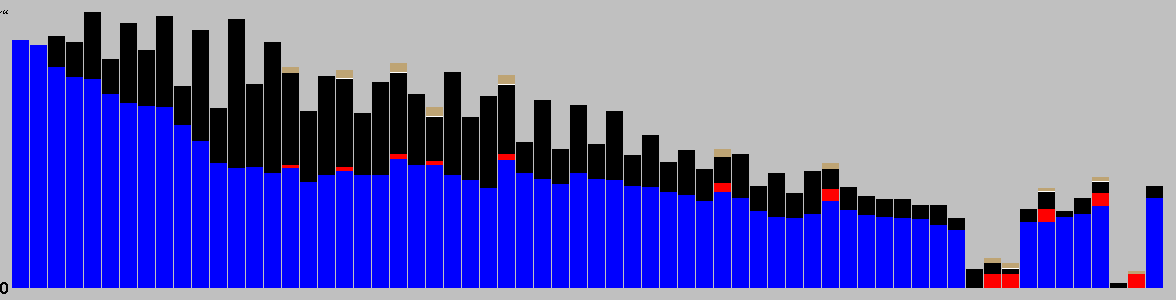
Action Types per Turn
This chart is based on a single representative* game, and gives a feel for the types of moves available throughout that game. (* Representative in the sense that it is close to the mean game length.)
This chart shows the best move value with respect to the active player; the orange line represents the value of doing nothing (null move).
The lead changed on 1% of the game turns. Ai Ai found 6 critical turns (turns with only one good option).
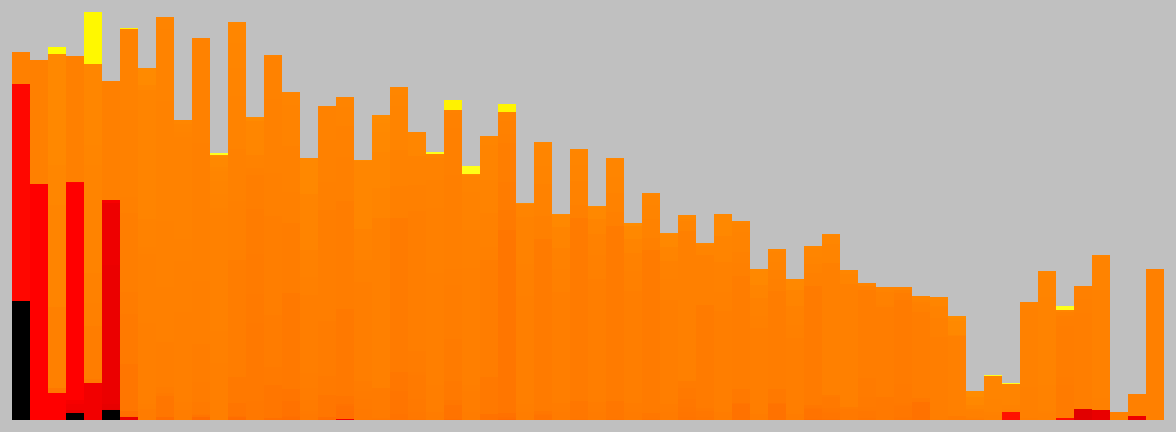
Position Heatmap
This chart shows the relative temperature of all moves each turn. Colour range: black (worst), red, orange(even), yellow, white(best).
Good/Effective moves
Measure
All players
Player 1
Player 2
Mean % of effective moves
90.46
86.73
94.68
Mean no. of effective moves
211.56
212.09
210.97
Effective game space
10^142.26
10^74.02
10^68.24
Mean % of good moves
37.73
47.49
26.66
Mean no. of good moves
98.75
146.26
44.90
Good move game space
10^83.45
10^56.31
10^27.14
These figures were calculated over a single game.
An effective move is one with score 0.1 of the best move (including the best move). -1 (loss) <= score <= 1 (win)
A good move has a score > 0. Note that when there are no good moves, an multiplier of 1 is used for the game space calculation.
Quality Measures
Measure
Value
Description
Hot turns
62.50%
A hot turn is one where making a move is better than doing nothing.
Momentum
15.62%
% of turns where a player improved their score.
Correction
34.38%
% of turns where the score headed back towards equality.
Depth
0.52%
Difference in evaluation between a short and long search.
Drama
1.51%
How much the winner was behind before their final victory.
Foulup Factor
73.44%
Moves that looked better than the best move after a short search.
Surprising turns
0.00%
Turns that looked bad after a short search, but good after a long one.
Last lead change
-1.56%
Distance through game when the lead changed for the last time.
Decisiveness
93.75%
Distance from the result being known to the end of the game.
These figures were calculated over a single representative* game, and based on the measures of quality described in "Automatic Generation and Evaluation of Recombination Games" (Cameron Browne, 2007). (* Representative, in the sense that it is close to the mean game length.)
Openings
Moves
Animation
e2E'SW,f5W'SE,e2g2S'NW,f5e5N'SW
e4W'SE,c7W'SE,e4e2S'NE,c7c6W'SE
g4S'NW,d6W'NE,g4f4W'NE,d6d7S'NW
e6S'NE,c7W'SE,e6e2S'NE,c7c6W'SE
g6W'SE,d6W'SE,g6g5N'SW,d6d8N'SW
a2W'SE,d8N'SW,a2c2S'NE,d8d6W'SE
c4S'NE,d8N'SW,c4c2S'NE,d8d6W'SE
e4W'SE,c7W'SE,e4e2S'NE,c7a7W'SE
g4S'NW,d6W'NE,g4f4W'NE,d6d5N'SE
c5W'SE,d8N'SW,c5c2S'NE,d8d6W'SE
e6S'NE,c7W'SE,e6e2S'NE,c7a7W'SE
g7E'NW,g2W'SE,g7d7E'NW,g2c2N'SW
Opening Heatmap
Colour shows the success ratio of this play over the first 10moves; black < red < yellow < white.
Size shows the frequency this move is played.
Unique Positions Reachable at Depth
0
1
2
1
368
127568
Note: most games do not take board rotation and reflection into consideration. Multi-part turns could be treated as the same or different depth depending on the implementation. Counts to depth N include all moves reachable at lower depths. Inaccuracies may also exist due to hash collisions, but Ai Ai uses 64-bit hashes so these will be a very small fraction of a percentage point.