Generated at 8/14/23, 10:29 AM from 1000 logged games.
Rules
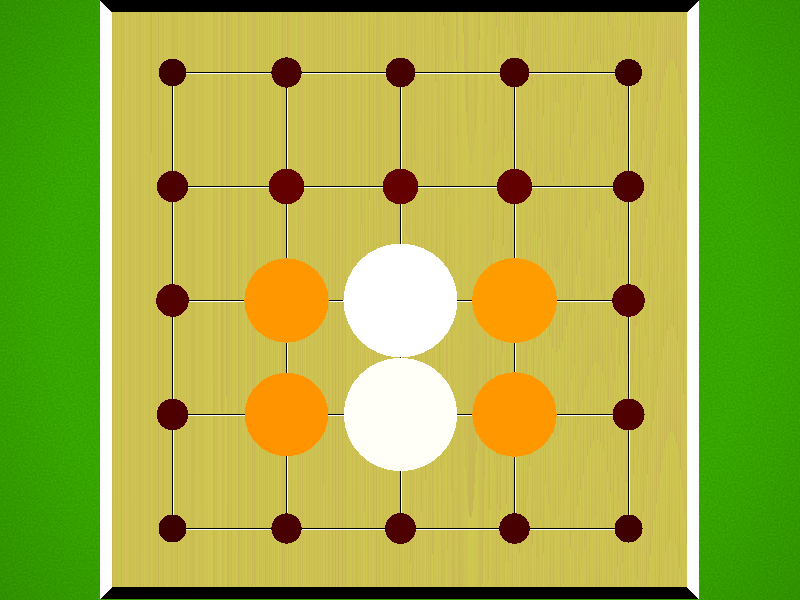
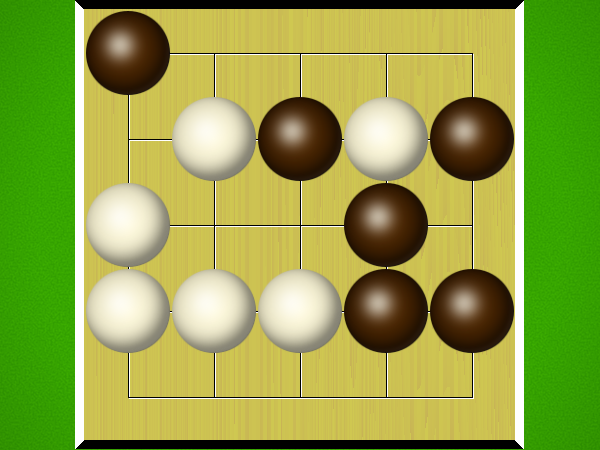
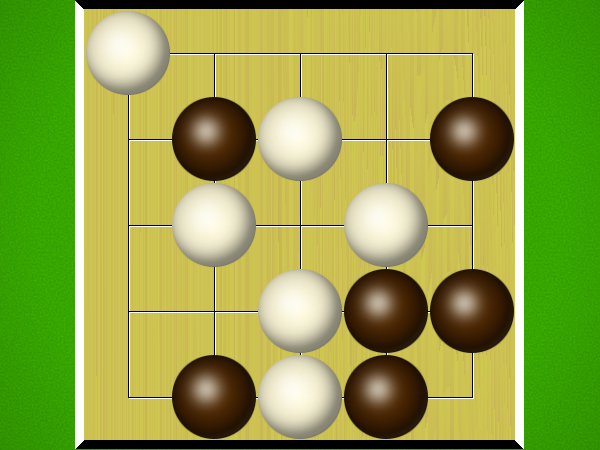
Representative game (in the sense of being of mean length). Wherever you see the 'representative game' referred to in later sections, this is it!
Same-colored stones with orthogonal adjacency are connected.
The game is over when a player wins by connecting their designated sides of the board with a single group of connected stones of their color, at any time during their turn or their opponent's turn. Cutting stones are four stones in the following generic crosscut configuration:
OXXO
On your turn you may select one of two actions:
Place a stone of your color on an empty point. If that stone creates a crosscut, swap it with different adjacent enemy stones that share a crosscut with it, until that stone is no longer part of a crosscut.
Choose a stone of your color that is part of a crosscut, and use it to resolve crosscuts as in 1) . Then place a stone of your color on an empty point, if possible.
Resolve was designed by Alek Erickson in July 2020, and the rules were eventually finalized through critical discussions and play testing with Dale Walton and Luis Bolaños Mures. The game was partly inspired by Michal Zapawa's swap mechanic from Slyde. The original idea for swapping stones to resolve crosscuts can be traced to Phil Leduc's Thruway and Bill Taylor's Swapway as early as 2008, but the "resolving stone" mechanism, where a single stone gets serially swapped to fix cuts in Resolve is novel.
Ai Ai calculates the size of the implementation, and compares it to the Ai Ai implementation of the simplest possible game (which just fills the board). Note that this estimate may include some graphics and heuristics code as well as the game logic. See the wikipedia entry for more details.
Playout Complexity Estimate
Playouts per second
47175.31 (21.20µs/playout)
Reference Size
205061.03 (4.88µs/playout)
Ratio (low is good)
4.35
Tavener complexity: the heat generated by playing every possible instance of a game with a perfectly efficient programme. Since this is not possible to calculate, Ai Ai calculates the number of random playouts per second and compares it to the fastest non-trivial Ai Ai game (Connect 4). This ratio gives a practical indication of how complex the game is. Combine this with the computational state space, and you can get an idea of how strong the default (MCTS-based) AI will be.
State Space Complexity
% new positions/bucket
State Space Complexity
27215583
State Space Complexity (log 10)
7.43
Samples
1357406
Confidence
10.49
0: totally unreliable, 100: perfect
State space complexity (where present) is an estimate of the number of distinct game tree reachable through actual play. Over a series of random games, Ai Ai checks each position to see if it is new, or a repeat of a previous position and keeps a total for each game. As the number of games increase, the quantity of new positions seen per game decreases. These games are then partitioned into a number of buckets, and if certain conditions are met, Ai Ai treats the number in each bucket as the start of a strictly decreasing geometric sequence and sums it to estimate the total state space. The accuracy is calculated as 1-[end bucket count]/[starting bucklet count]
Playout/Search Speed
Label
Its/s
SD
Nodes/s
SD
Game length
SD
Random playout
107,239
29,667
2,586,870
715,657
24
3
search.UCT
113,542
31,917
20
6
Random: 10 second warmup for the hotspot compiler. 100 trials of 1000ms each.
Other: 100 playouts, means calculated over the first 5 moves only to avoid distortion due to speedup at end of game.
Mirroring Strategies
Rotation (Half turn) lost each game as expected.
Reflection (X axis) lost each game as expected.
Reflection (Y axis) lost each game as expected.
Copy last move lost each game as expected.
Mirroring strategies attempt to copy the previous move. On first move, they will attempt to play in the centre. If neither of these are possible, they will pick a random move. Each entry represents a different form of copying; direct copy, reflection in either the X or Y axis, half-turn rotation.
Win % By Player (Bias)
1: White win %
65.30±3.00
Includes draws = 50%
2: Black win %
34.70±2.89
Includes draws = 50%
Draw %
0.00
Percentage of games where all players draw.
Decisive %
100.00
Percentage of games with a single winner.
Samples
1000
Quantity of logged games played
Note: that win/loss statistics may vary depending on thinking time (horizon effect, etc.), bad heuristics, bugs, and other factors, so should be taken with a pinch of salt. (Given perfect play, any game of pure skill will always end in the same result.)
Note: Ai Ai differentiates between states where all players draw or win or lose; this is mostly to support cooperative games.
UCT Skill Chains
Match
AI
Strong Wins
Draws
Strong Losses
#Games
Strong Score
p1 Win%
Draw%
p2 Win%
Game Length
0
Random
1
UCT (its=2)
631
0
276
907
0.6650 <= 0.6957 <= 0.7248
51.27
0.00
48.73
23.39
5
UCT (its=6)
631
0
359
990
0.6069 <= 0.6374 <= 0.6667
50.51
0.00
49.49
23.26
11
UCT (its=12)
631
0
356
987
0.6089 <= 0.6393 <= 0.6687
50.96
0.00
49.04
22.74
17
UCT (its=18)
631
0
342
973
0.6180 <= 0.6485 <= 0.6779
50.77
0.00
49.23
22.06
25
UCT (its=68)
631
0
114
745
0.8194 <= 0.8470 <= 0.8710
51.81
0.00
48.19
19.42
26
UCT (its=185)
631
0
201
832
0.7282 <= 0.7584 <= 0.7863
51.56
0.00
48.44
17.52
27
UCT (its=502)
631
0
318
949
0.6343 <= 0.6649 <= 0.6942
54.58
0.00
45.42
16.58
28
UCT (its=1365)
631
0
361
992
0.6057 <= 0.6361 <= 0.6655
52.32
0.00
47.68
16.60
29
UCT (its=3710)
631
0
360
991
0.6063 <= 0.6367 <= 0.6661
48.13
0.00
51.87
16.81
30
UCT (its=10086)
631
0
258
889
0.6791 <= 0.7098 <= 0.7387
44.32
0.00
55.68
17.44
31
UCT (its=27416)
631
0
255
886
0.6815 <= 0.7122 <= 0.7410
60.50
0.00
39.50
18.83
32
UCT (its=27416)
518
0
482
1000
0.4870 <= 0.5180 <= 0.5488
74.80
0.00
25.20
21.17
Search for levels ended: time limit reached.
Level of Play: Strong beats Weak 60% of the time (lower bound with 95% confidence).
Draw%, p1 win% and game length may give some indication of trends as AI strength increases.
1st Player Win Ratios by Playing Strength
This chart shows the win(green)/draw(black)/loss(red) percentages, as UCT play strength increases. Note that for most games, the top playing strength show here will be distinctly below human standard.
Complexity
Game length
37.63
Branching factor
15.38
Complexity
10^30.08
Based on game length and branching factor
Samples
1000
Quantity of logged games played
Computational complexity (where present) is an estimate of the game tree reachable through actual play. For each game in turn, Ai Ai marks the positions reached in a hashtable, then counts the number of new moves added to the table. Once all moves are applied, it treats this sequence as a geometric progression and calculates the sum as n-> infinity.
Move Classification
Board Size
25
Quantity of distinct board cells
Distinct actions
105
Quantity of distinct moves (e.g. "e4") regardless of position in game tree
Killer moves
35
A 'killer' move is selected by the AI more than 50% of the time Too many killers to list.
Good moves
74
A good move is selected by the AI more than the average
Bad moves
31
A bad move is selected by the AI less than the average
Response distance%
46.41%
Distance from move to response / maximum board distance; a low value suggests a game is tactical rather than strategic.
Samples
1000
Quantity of logged games played
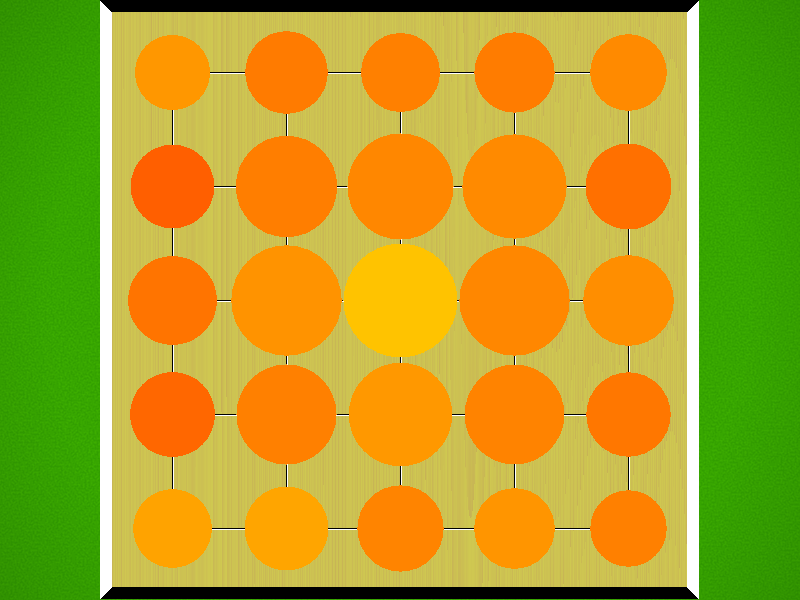
Board Coverage
A mean of 66.96% of board locations were used per game.
Colour and size show the frequency of visits.
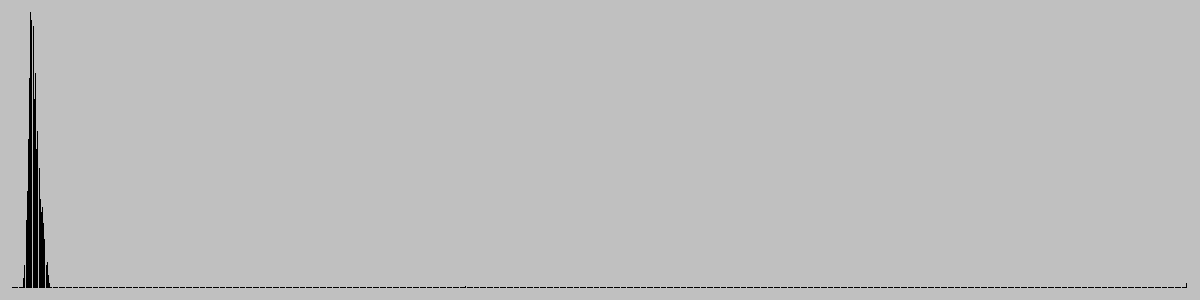
Game Length
Game length frequencies.
Mean
21.36
Mode
[16]
Median
18.0
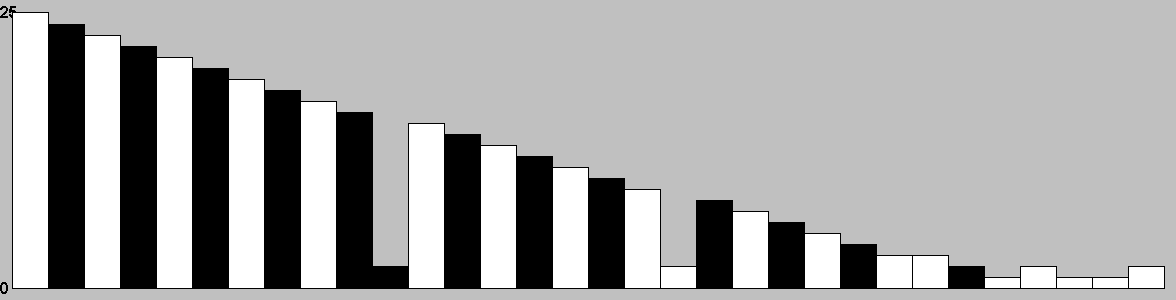
Change in Material Per Turn
Mean change in material/round
0.96
Complete round of play (all players)
This chart is based on a single representative* playout, and gives a feel for the change in material over the course of a game. (* Representative in the sense that it is close to the mean length.)
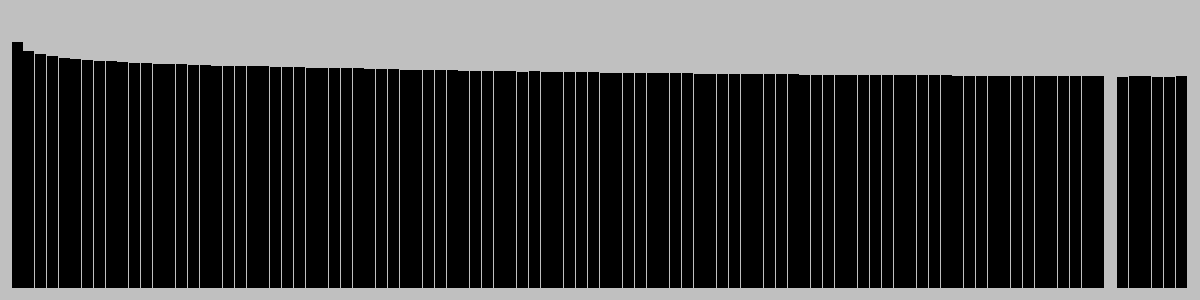
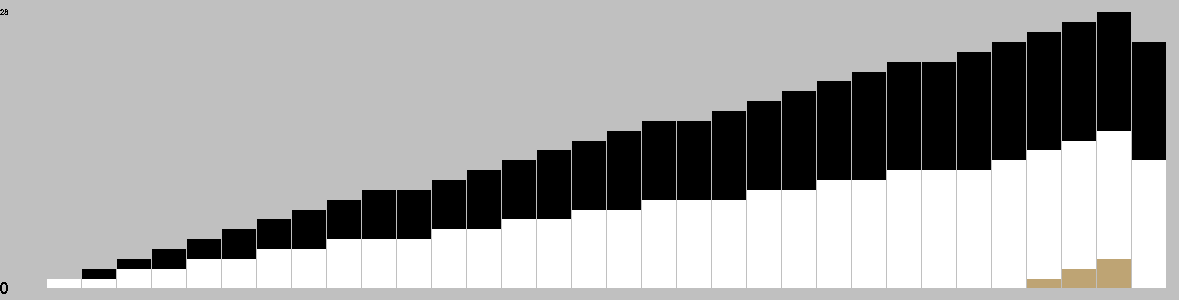
Actions/turn
Table: branching factor per turn, based on a single representative* game. (* Representative in the sense that it is close to the mean game length.)
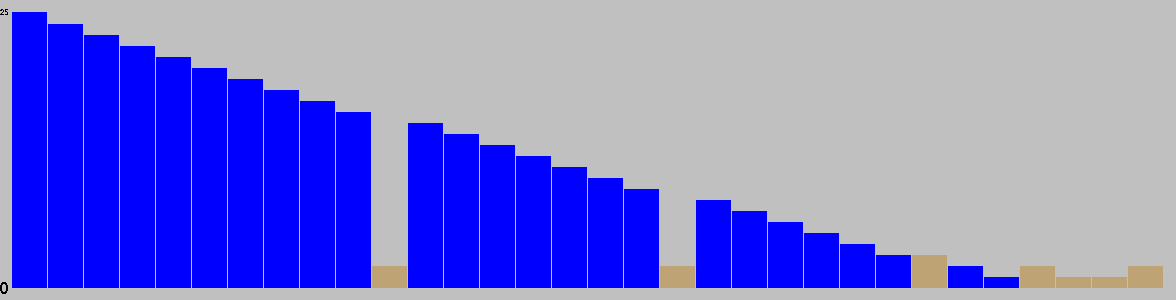
Action Types per Turn
This chart is based on a single representative* game, and gives a feel for the types of moves available throughout that game. (* Representative in the sense that it is close to the mean game length.)
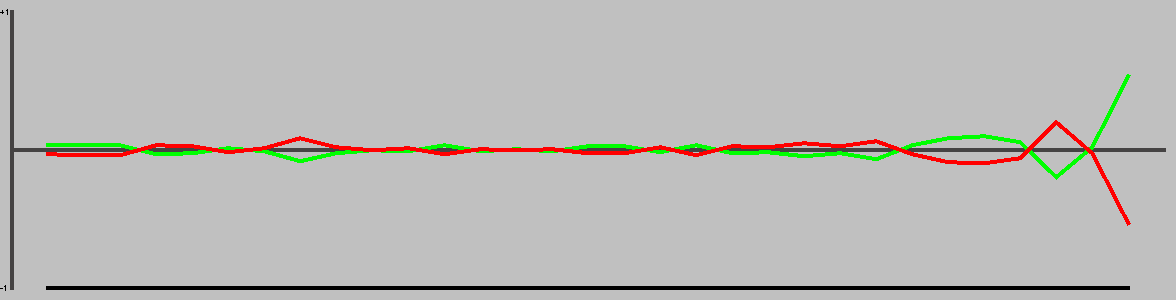
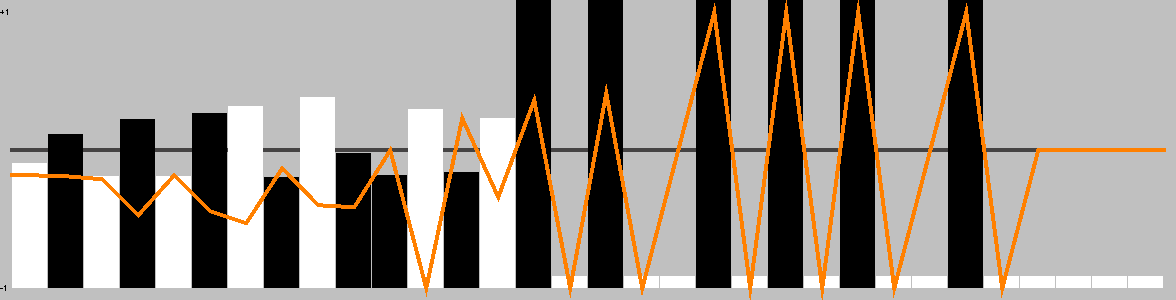
This chart shows the best move value with respect to the active player; the orange line represents the value of doing nothing (null move).
The lead changed on 6% of the game turns. Ai Ai found 9 critical turns (turns with only one good option).
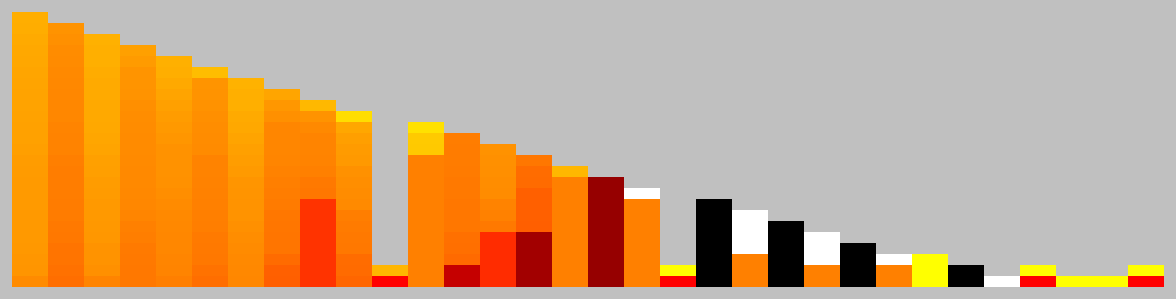
Position Heatmap
This chart shows the relative temperature of all moves each turn. Colour range: black (worst), red, orange(even), yellow, white(best).
Good/Effective moves
Measure
All players
Player 1
Player 2
Mean % of effective moves
51.95
47.53
58.40
Mean no. of effective moves
3.62
2.84
4.77
Effective game space
10^11.86
10^5.40
10^6.46
Mean % of good moves
35.01
47.58
16.65
Mean no. of good moves
2.72
3.32
1.85
Good move game space
10^7.15
10^4.92
10^2.23
These figures were calculated over a single game.
An effective move is one with score 0.1 of the best move (including the best move). -1 (loss) <= score <= 1 (win)
A good move has a score > 0. Note that when there are no good moves, an multiplier of 1 is used for the game space calculation.
Quality Measures
Measure
Value
Description
Hot turns
81.25%
A hot turn is one where making a move is better than doing nothing.
Momentum
6.25%
% of turns where a player improved their score.
Correction
18.75%
% of turns where the score headed back towards equality.
Depth
7.90%
Difference in evaluation between a short and long search.
Drama
2.82%
How much the winner was behind before their final victory.
Foulup Factor
21.88%
Moves that looked better than the best move after a short search.
Surprising turns
3.12%
Turns that looked bad after a short search, but good after a long one.
Last lead change
46.88%
Distance through game when the lead changed for the last time.
Decisiveness
56.25%
Distance from the result being known to the end of the game.
These figures were calculated over a single representative* game, and based on the measures of quality described in "Automatic Generation and Evaluation of Recombination Games" (Cameron Browne, 2007). (* Representative, in the sense that it is close to the mean game length.)
Openings
Moves
Animation
c2,a2,d2,d4
d2,a2,c2,d4
e4,b2,a3,e3
d4,d3,d5,b5
a1,b3,c1
b1,c2,e3
b1,b3,d4
b1,d5,b2
b1,d5,c5
c1,c2,e5
c1,a3,e3
c1,c5,a2
Opening Heatmap
Colour shows the success ratio of this play over the first 10moves; black < red < yellow < white.
Size shows the frequency this move is played.
Unique Positions Reachable at Depth
0
1
2
3
4
5
6
1
25
625
7525
83457
615429
4170713
Note: most games do not take board rotation and reflection into consideration. Multi-part turns could be treated as the same or different depth depending on the implementation. Counts to depth N include all moves reachable at lower depths. Inaccuracies may also exist due to hash collisions, but Ai Ai uses 64-bit hashes so these will be a very small fraction of a percentage point.
Shortest Game(s)
No solutions found to depth 6.
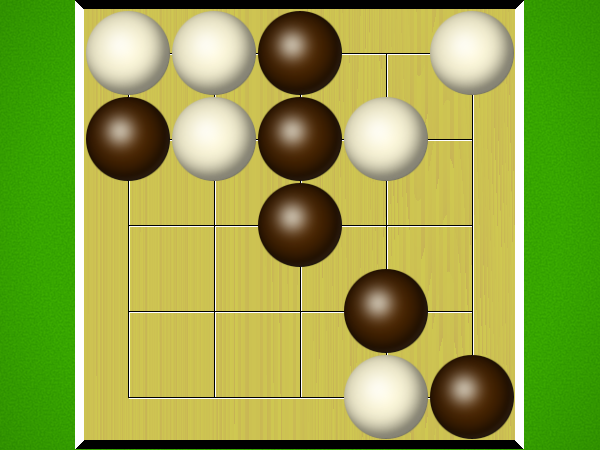
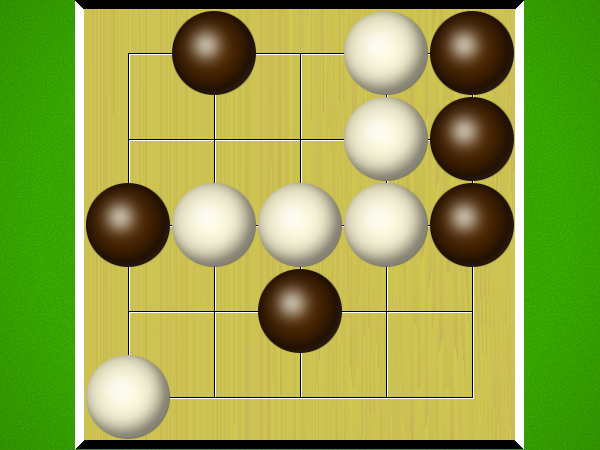
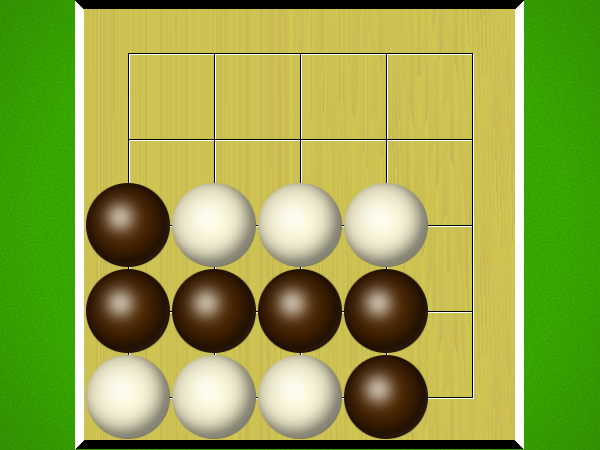
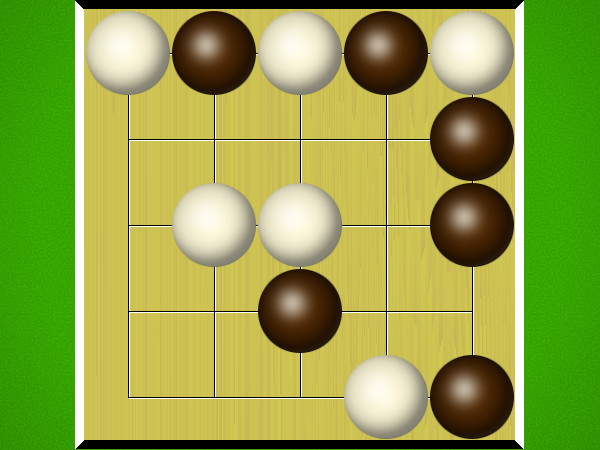
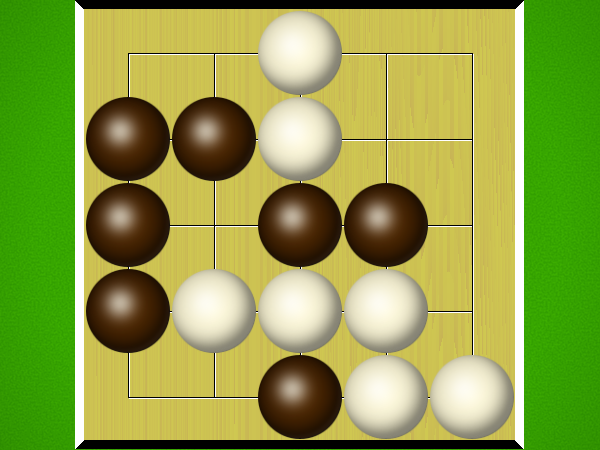
Puzzles
Puzzle
Solution
White to win in 22 moves
White to win in 17 moves
White to win in 20 moves
White to win in 19 moves
White to win in 16 moves
Black to win in 17 moves
White to win in 11 moves
White to win in 16 moves
White to win in 12 moves
White to win in 14 moves
White to win in 18 moves
White to win in 11 moves
Selection criteria: first move must be unique, and not forced to avoid losing. Beyond that, Puzzles will be rated by the product of [total move]/[best moves] at each step, and the best puzzles selected.