Unify your pieces to create the largest group at the end of the game.
Generated at 11/06/2020, 17:00 from 1000 logged games.
Rules
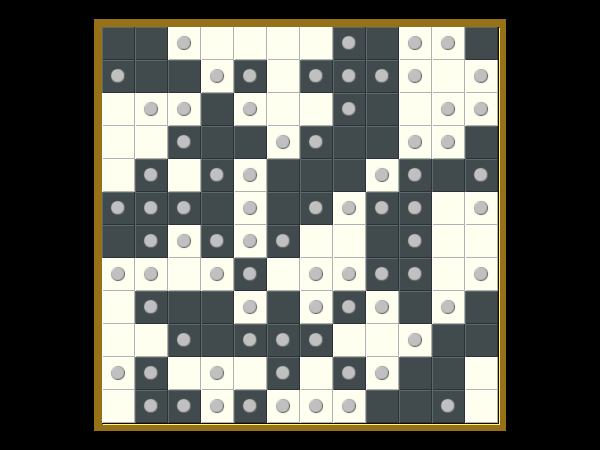
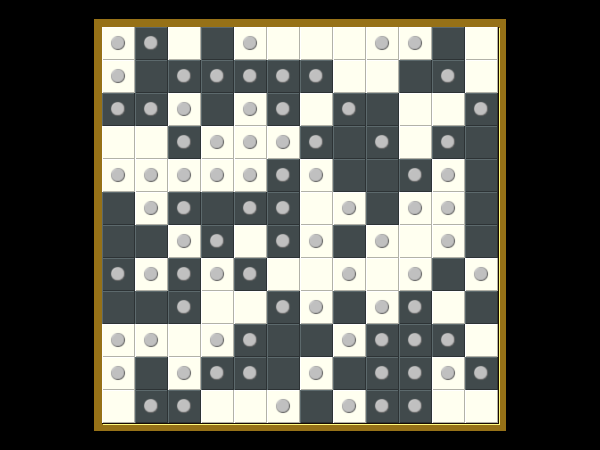
Representative game (in the sense of being of mean length). Wherever you see the 'representative game' referred to in later sections, this is it!
Play
Each player controls a set of pawns, Black or White. The pawns can appear in two states: fixed or mobile. At the beginning, the entire 12x12 board is covered in mobile pawns, which alternate in colour to create a checker pattern. White starts the game, then players move alternately. During a move, a player swaps one of his mobile pawns with an adjacent mobile pawn of his opponent. The player's pawn then becomes fixed, but the opponent's pawn does not.
Goal
The game ends when there are no more legal moves. The player who controls the biggest group (defined by orthogonal connectivity of like-coloured pawns) is the winner. If the two biggest groups are equal in size, the second-biggest groups are compared, and so on.
Symmetry
Symmetric play can be quite a nuisance, so there's a special rule to discourage it; the rule is not enforced in Ai Ai for performance reasons, but is described here for completeness. If a board is in a symmetric position, the next player to move can change the state (mobile/fixed) of any pawn regardless of color instead of doing a standard swap. This does not apply to the first move.
Original concept, elegant rules and fun to play. Try it out on Mindsports.nl Can be easily played with generic equipment.
Kolomogorov Complexity Analysis
Size (bytes)
25800
Reference Size
10293
Ratio
2.51
Ai Ai calculates the size of the implementation, and compares it to the Ai Ai implementation of the simplest possible game (which just fills the board). Note that this estimate may include some graphics and heuristics code as well as the game logic. See the wikipedia entry for more details.
Playout Complexity Estimate
Playouts per second
10334.54 (96.76µs/playout)
Reference Size
534045.39 (1.87µs/playout)
Ratio (low is good)
51.68
Tavener complexity: the heat generated by playing every possible instance of a game with a perfectly efficient programme. Since this is not possible to calculate, Ai Ai calculates the number of random playouts per second and compares it to the fastest non-trivial Ai Ai game (Connect 4). This ratio gives a practical indication of how complex the game is. Combine this with the computational state space, and you can get an idea of how strong the default (MCTS-based) AI will be.
Playout/Search Speed
Label
Its/s
SD
Nodes/s
SD
Game length
SD
Random playout
12,886
169
1,205,081
15,839
94
4
search.UCB
13,303
486
90
4
search.UCT
11,414
2,562
90
5
Random: 10 second warmup for the hotspot compiler. 100 trials of 1000ms each.
Other: 100 playouts, means calculated over the first 5 moves only to avoid distortion due to speedup at end of game.
Mirroring Strategies
Rotation (Half turn) lost each game as expected.
Reflection (X axis) lost each game as expected.
Reflection (Y axis) lost each game as expected.
Copy last move lost each game as expected.
Mirroring strategies attempt to copy the previous move. On first move, they will attempt to play in the centre. If neither of these are possible, they will pick a random move. Each entry represents a different form of copying; direct copy, reflection in either the X or Y axis, half-turn rotation.
Win % By Player (Bias)
1: White win %
53.30±3.10
Includes draws = 50%
2: Black win %
46.70±3.07
Includes draws = 50%
Draw %
0.00
Percentage of games where all players draw.
Decisive %
100.00
Percentage of games with a single winner.
Samples
1000
Quantity of logged games played
Note: that win/loss statistics may vary depending on thinking time (horizon effect, etc.), bad heuristics, bugs, and other factors, so should be taken with a pinch of salt. (Given perfect play, any game of pure skill will always end in the same result.)
Note: Ai Ai differentiates between states where all players draw or win or lose; this is mostly to support cooperative games.
Levels of Play
AI
Strong Wins
Draws
Strong Losses
#Games
Strong Win%
p1 Win%
Game Length
Random
Grand Unified UCT(U1-T,rSel=s, secs=0.01)
36
0
0
36
100.00
66.67
92.00
Grand Unified UCT(U1-T,rSel=s, secs=0.03)
36
0
3
39
92.31
35.90
92.49
Grand Unified UCT(U1-T,rSel=s, secs=0.07)
36
0
3
39
92.31
46.15
92.51
Grand Unified UCT(U1-T,rSel=s, secs=0.20)
36
0
4
40
90.00
37.50
91.35
Grand Unified UCT(U1-T,rSel=s, secs=0.55)
36
0
2
38
94.74
47.37
90.39
Level of Play: Strong beats Weak 60% of the time (lower bound with 90% confidence).
Draw%, p1 win% and game length may give some indication of trends as AI strength increases; but be aware that the AI can introduce bias due to horizon effects, poor heuristics, etc.
Complexity
Game length
91.09
Branching factor
86.19
Complexity
10^152.56
Based on game length and branching factor
Computational Complexity
10^8.06
Sample quality (100 best): 2.27
Samples
1000
Quantity of logged games played
Computational complexity (where present) is an estimate of the game tree reachable through actual play. For each game in turn, Ai Ai marks the positions reached in a hashtable, then counts the number of new moves added to the table. Once all moves are applied, it treats this sequence as a geometric progression and calculates the sum as n-> infinity.
Move Classification
Distinct actions
528
Number of distinct moves (e.g. "e4") regardless of position in game tree
Good moves
218
A good move is selected by the AI more than the average
Bad moves
310
A bad move is selected by the AI less than the average
Response distance
7.12
Mean distance between move and response; a low value relative to the board size may mean a game is tactical rather than strategic.
Samples
1000
Quantity of logged games played
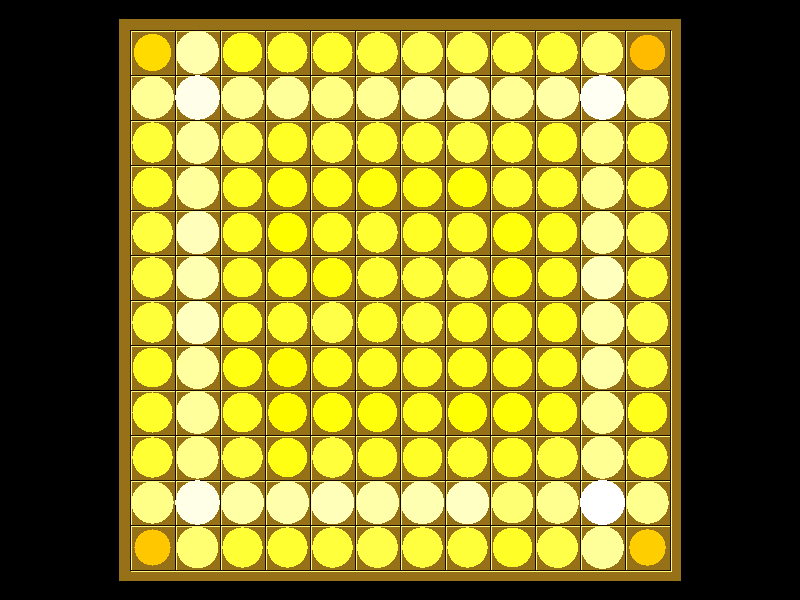
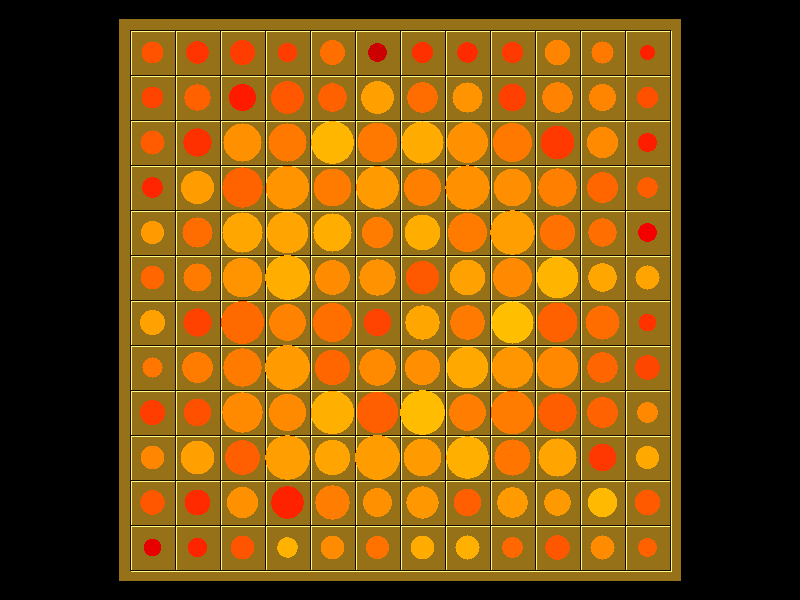
Board Coverage
A mean of 90.93% of board locations were used per game.
Colour and size show the frequency of visits.
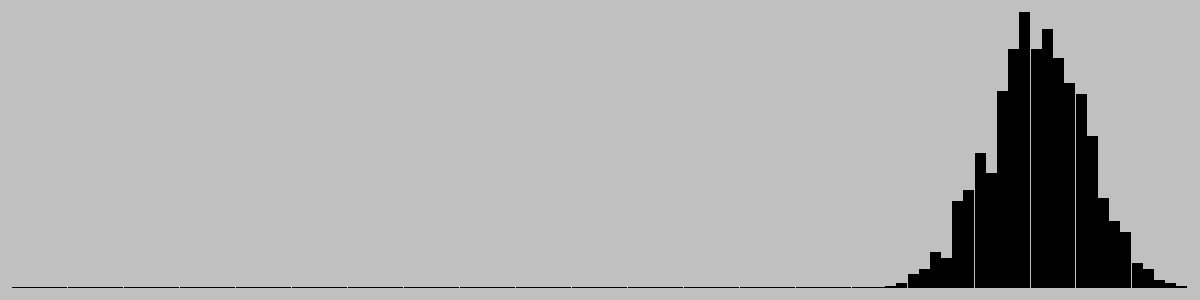
Game Length
Game length frequencies.
Mean
91.09
Mode
[90]
Median
91.0
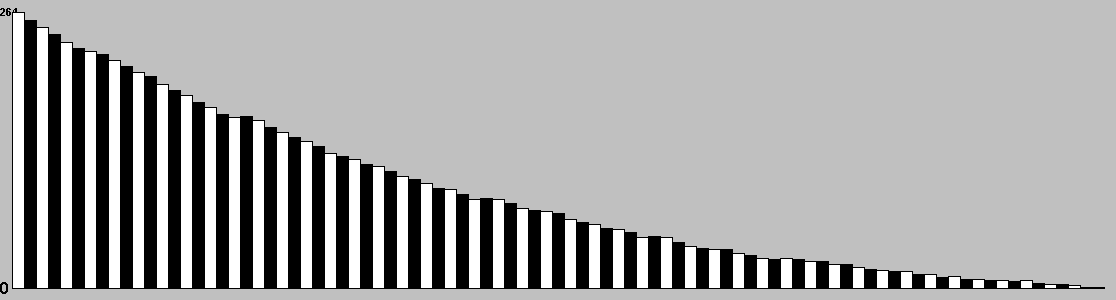
Change in Material Per Turn
This chart is based on a single representative* playout, and gives a feel for the change in material over the course of a game. (* Representative in the sense that it is close to the mean length.)
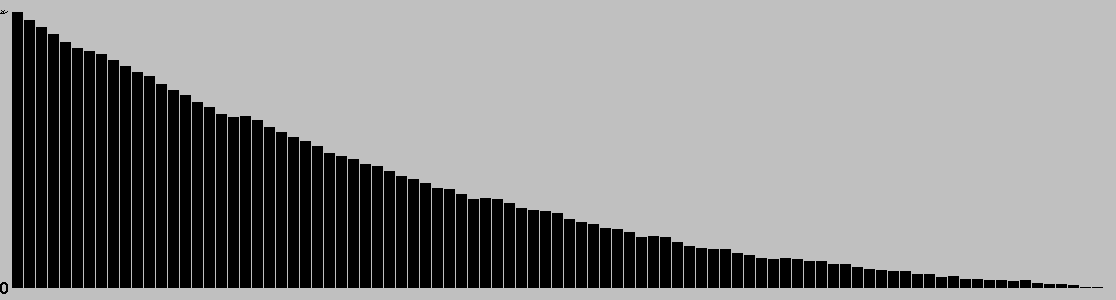
Actions/turn
Table: branching factor per turn, based on a single representative* game. (* Representative in the sense that it is close to the mean game length.)
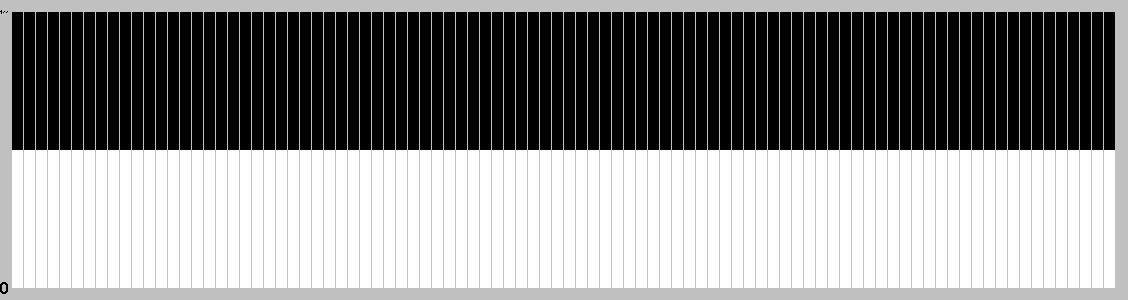
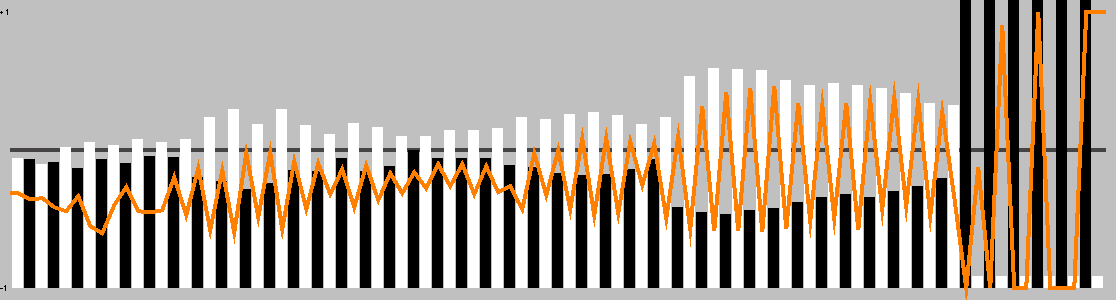
Action Types per Turn
This chart is based on a single representative* game, and gives a feel for the types of moves available throughout that game. (* Representative in the sense that it is close to the mean game length.)
This chart shows the best move value with respect to the active player; the orange line represents the value of doing nothing (null move).
The lead changed on 17% of the game turns. Ai Ai found 5 critical turns (turns with only one good option).
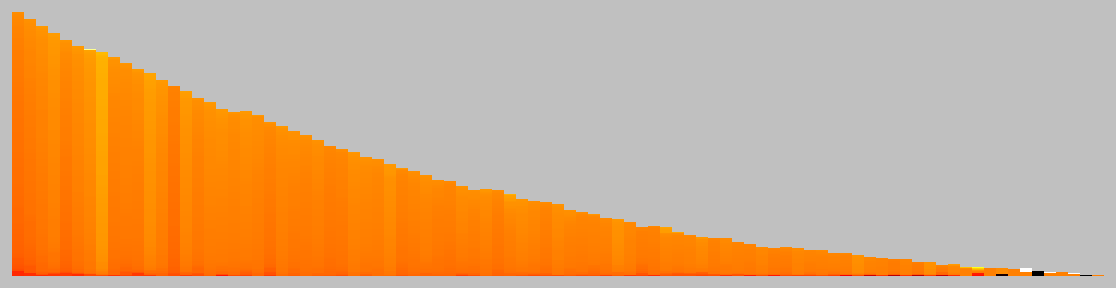
Position Heatmap
This chart shows the relative temperature of all moves each turn. Colour range: black (worst), red, orange(even), yellow, white(best).
Good/Effective moves
Measure
All players
Player 1
Player 2
Mean % of effective moves
25.08
20.97
29.27
Mean no. of effective moves
4.24
3.80
4.69
Effective game space
10^32.60
10^14.06
10^18.53
Mean % of good moves
22.32
7.14
37.85
Mean no. of good moves
8.45
0.39
16.69
Good move game space
10^38.38
10^1.98
10^36.40
These figures were calculated over a single game.
An effective move is one with score 0.1 of the best move (including the best move). -1 (loss) <= score <= 1 (win)
A good move has a score > 0. Note that when there are no good moves, an multiplier of 1 is used for the game space calculation.
Quality Measures
Measure
Value
Description
Hot turns
91.21%
A hot turn is one where making a move is better than doing nothing.
Momentum
23.08%
% of turns where a player improved their score.
Correction
47.25%
% of turns where the score headed back towards equality.
Depth
4.77%
Difference in evaluation between a short and long search.
Drama
7.83%
How much the winner was behind before their final victory.
Foulup Factor
6.59%
Moves that looked better than the best move after a short search.
Surprising turns
0.00%
Turns that looked bad after a short search, but good after a long one.
Last lead change
87.91%
Distance through game when the lead changed for the last time.
Decisiveness
13.19%
Distance from the result being known to the end of the game.
These figures were calculated over a single representative* game, and based on the measures of quality described in "Automatic Generation and Evaluation of Recombination Games" (Cameron Browne, 2007). (* Representative, in the sense that it is close to the mean game length.)
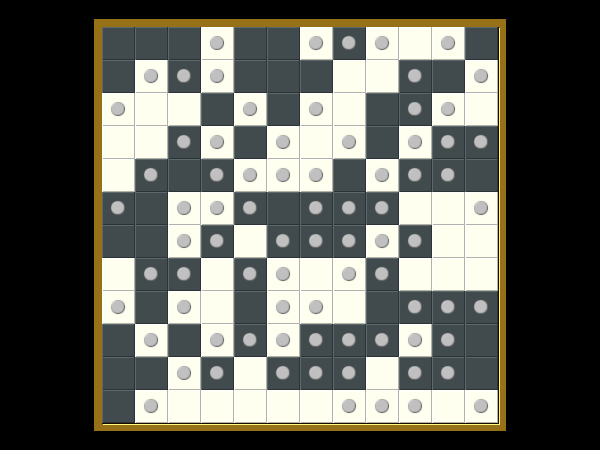
Opening Heatmap
Colour shows the success ratio of this play over the first 10moves; black < red < yellow < white.
Size shows the frequency this move is played.
Unique Positions Reachable at Depth
0
1
2
3
1
264
68248
8574476
Note: most games do not take board rotation and reflection into consideration. Multi-part turns could be treated as the same or different depth depending on the implementation. Counts to depth N include all moves reachable at lower depths. Inaccuracies may also exist due to hash collisions, but Ai Ai uses 64-bit hashes so these will be a very small fraction of a percentage point.
Shortest Game(s)
No solutions found to depth 3.
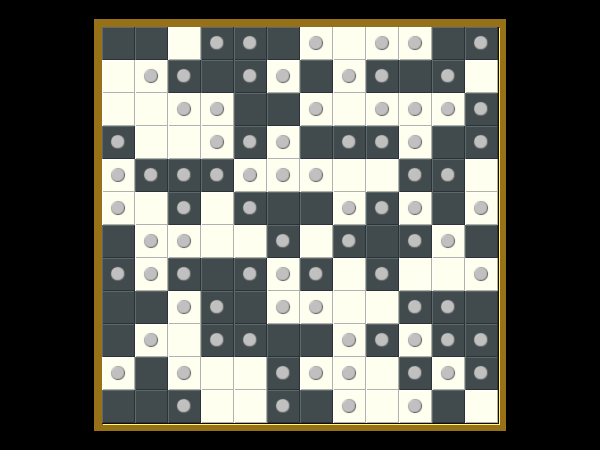
Puzzles
Puzzle
Solution
White to win in 17 moves
White to win in 13 moves
White to win in 6 moves
White to win in 10 moves
White to win in 7 moves
Black to win in 10 moves
Black to win in 6 moves
Black to win in 7 moves
White to win in 9 moves
White to win in 7 moves
White to win in 6 moves
Black to win in 4 moves
Selection criteria: first move must be unique, and not forced to avoid losing. Beyond that, Puzzles will be rated by the product of [total move]/[best moves] at each step, and the best puzzles selected.