Generated at 14/03/2021, 19:23 from 1000 logged games.
Rules
Representative game (in the sense of being of mean length). Wherever you see the 'representative game' referred to in later sections, this is it!
Definitions
In these rules, "adjacent" always means "orthogonally adjacent".
A stack is a piece lying directly on the board along with all other pieces piled onto it on the same square. The color of a stack is the color of its topmost piece, which denotes its owner. The height of a stack is the number of pieces in it.
A group is a stack along with all other like-colored stacks one could reach from it through a series of steps between adjacent stacks of its color. The size of a group is the number of stacks in it.
Play
Black plays first, then turns alternate. On your turn, perform exactly one of the following actions:
Pass.
Move the topmost piece of a stack of your color onto an adjacent enemy stack, provided that, before the move, the heights of both stacks are the same. Then, place a piece of your opponent's color onto the stack from which you just moved your piece.
The game ends when both players pass in succession. Then, the players jointly remove pairs of opposite-colored groups of the same size from the board until there are no more such pairs to remove. The player with the biggest group left over wins. On even-sized boards, if the board is empty, whoever made the last move before the game's end loses.
Pie rule (not implemented)
The pie rule is used in order to make the game fair. This means White will have the option, on their first turn only, to swap sides with their opponent instead of making a regular move.
Ai Ai calculates the size of the implementation, and compares it to the Ai Ai implementation of the simplest possible game (which just fills the board). Note that this estimate may include some graphics and heuristics code as well as the game logic. See the wikipedia entry for more details.
Playout Complexity Estimate
Playouts per second
8386.65 (119.24µs/playout)
Reference Size
1781261.13 (0.56µs/playout)
Ratio (low is good)
212.39
Tavener complexity: the heat generated by playing every possible instance of a game with a perfectly efficient programme. Since this is not possible to calculate, Ai Ai calculates the number of random playouts per second and compares it to the fastest non-trivial Ai Ai game (Connect 4). This ratio gives a practical indication of how complex the game is. Combine this with the computational state space, and you can get an idea of how strong the default (MCTS-based) AI will be.
Playout/Search Speed
Label
Its/s
SD
Nodes/s
SD
Game length
SD
Random playout
8,357
80
807,505
7,681
97
15
search.UCB
8,543
227
87
23
search.UCT
8,519
160
85
24
Random: 10 second warmup for the hotspot compiler. 100 trials of 1000ms each.
Other: 100 playouts, means calculated over the first 5 moves only to avoid distortion due to speedup at end of game.
Mirroring Strategies
Rotation (Half turn) lost each game as expected.
Reflection (X axis) lost each game as expected.
Reflection (Y axis) lost each game as expected.
Copy last move lost each game as expected.
Mirroring strategies attempt to copy the previous move. On first move, they will attempt to play in the centre. If neither of these are possible, they will pick a random move. Each entry represents a different form of copying; direct copy, reflection in either the X or Y axis, half-turn rotation.
Win % By Player (Bias)
1: White win %
47.00±3.08
Includes draws = 50%
2: Black win %
53.00±3.10
Includes draws = 50%
Draw %
0.00
Percentage of games where all players draw.
Decisive %
100.00
Percentage of games with a single winner.
Samples
1000
Quantity of logged games played
Note: that win/loss statistics may vary depending on thinking time (horizon effect, etc.), bad heuristics, bugs, and other factors, so should be taken with a pinch of salt. (Given perfect play, any game of pure skill will always end in the same result.)
Note: Ai Ai differentiates between states where all players draw or win or lose; this is mostly to support cooperative games.
UCT Skill Chains
Match
AI
Strong Wins
Draws
Strong Losses
#Games
Strong Score
p1 Win%
Draw%
p2 Win%
Game Length
0
Random
1
UCT (its=2)
631
0
323
954
0.6308 <= 0.6614 <= 0.6908
48.85
0.00
51.15
96.81
3
UCT (its=4)
631
0
364
995
0.6038 <= 0.6342 <= 0.6635
48.54
0.00
51.46
96.30
10
UCT (its=11)
631
0
317
948
0.6350 <= 0.6656 <= 0.6949
52.85
0.00
47.15
97.22
17
UCT (its=18)
631
0
357
988
0.6082 <= 0.6387 <= 0.6680
48.68
0.00
51.32
96.99
28
UCT (its=29)
631
0
349
980
0.6134 <= 0.6439 <= 0.6732
49.29
0.00
50.71
95.26
37
UCT (its=38)
553
0
447
1000
0.5220 <= 0.5530 <= 0.5836
51.30
0.00
48.70
94.68
38
UCT (its=38)
477
0
523
1000
0.4462 <= 0.4770 <= 0.5080
49.70
0.00
50.30
93.52
Search for levels ended: time limit reached.
Level of Play: Strong beats Weak 60% of the time (lower bound with 95% confidence).
Draw%, p1 win% and game length may give some indication of trends as AI strength increases.
1st Player Win Ratios by Playing Strength
This chart shows the win(green)/draw(black)/loss(red) percentages, as UCT play strength increases. Note that for most games, the top playing strength show here will be distinctly below human standard.
Complexity
Game length
93.33
Branching factor
49.86
Complexity
10^132.63
Based on game length and branching factor
Computational Complexity
10^7.99
Sample quality (100 best): 2.91
Samples
1000
Quantity of logged games played
Computational complexity (where present) is an estimate of the game tree reachable through actual play. For each game in turn, Ai Ai marks the positions reached in a hashtable, then counts the number of new moves added to the table. Once all moves are applied, it treats this sequence as a geometric progression and calculates the sum as n-> infinity.
Move Classification
Distinct actions
361
Number of distinct moves (e.g. "e4") regardless of position in game tree
Good moves
153
A good move is selected by the AI more than the average
Bad moves
208
A bad move is selected by the AI less than the average
Response distance
5.63
Mean distance between move and response; a low value relative to the board size may mean a game is tactical rather than strategic.
Samples
1000
Quantity of logged games played
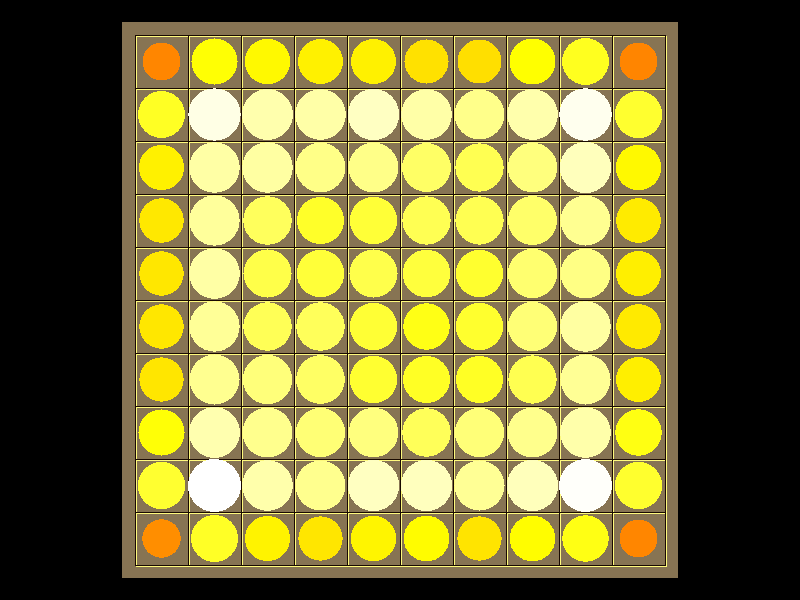
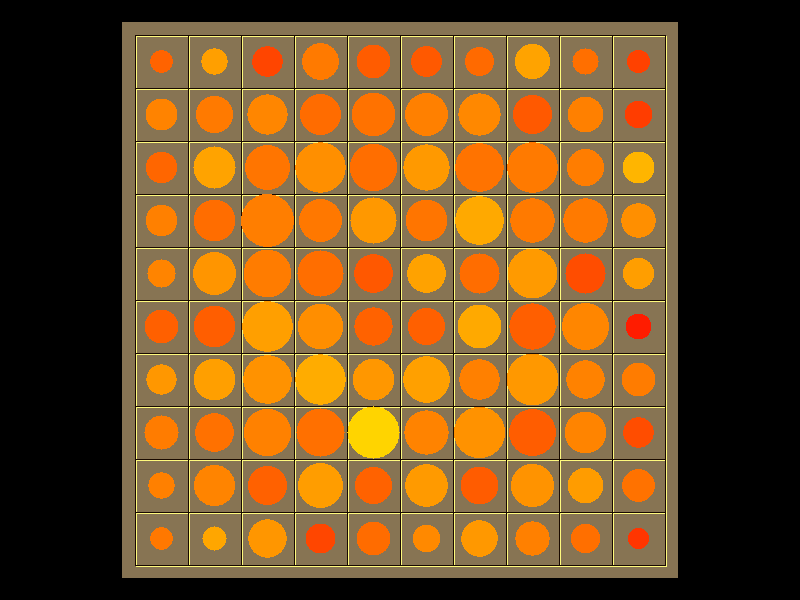
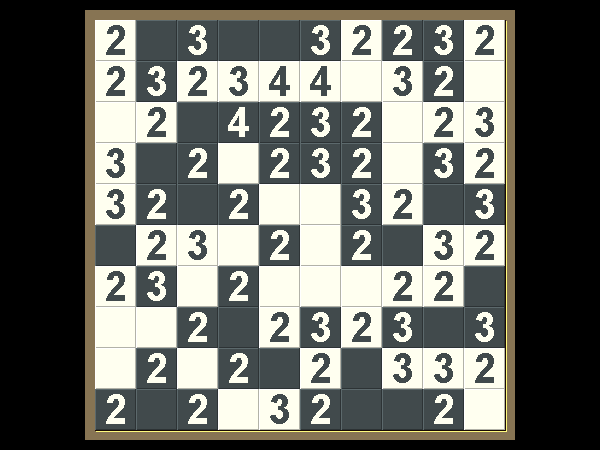
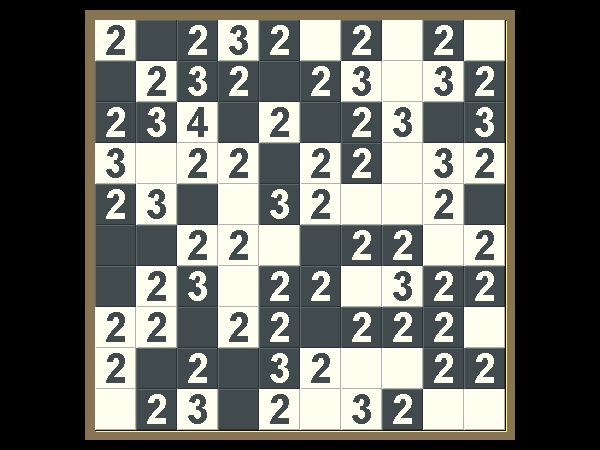
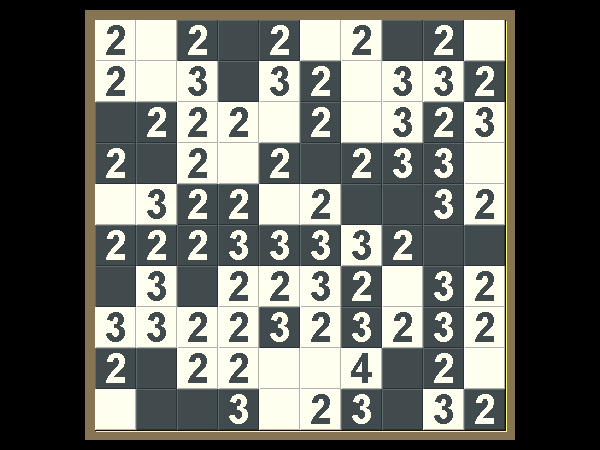
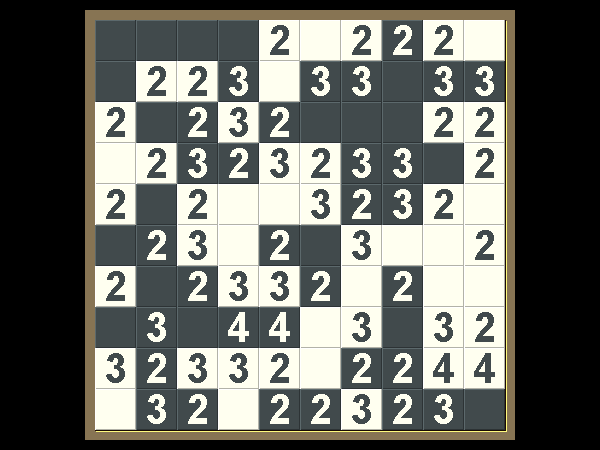
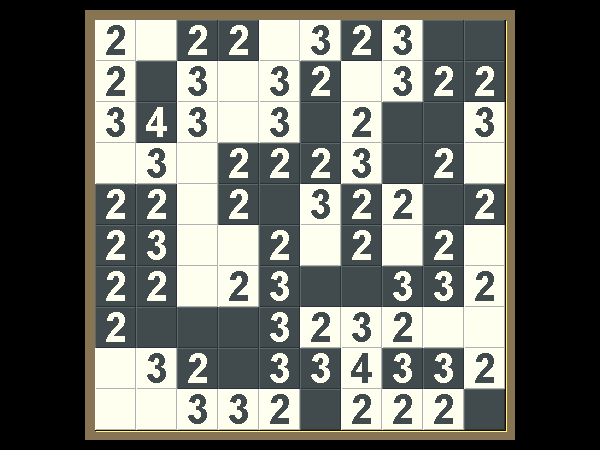
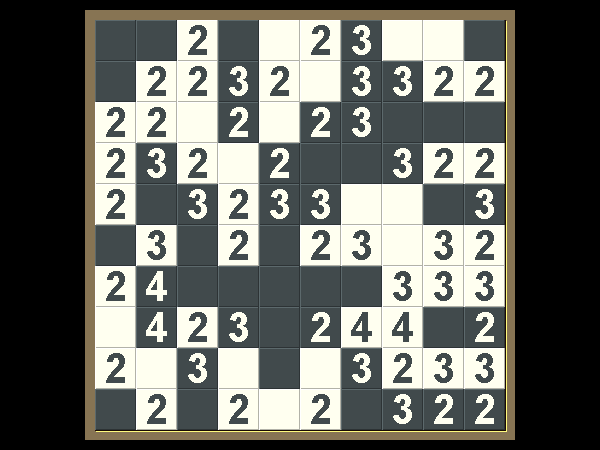
Board Coverage
A mean of 88.51% of board locations were used per game.
Colour and size show the frequency of visits.
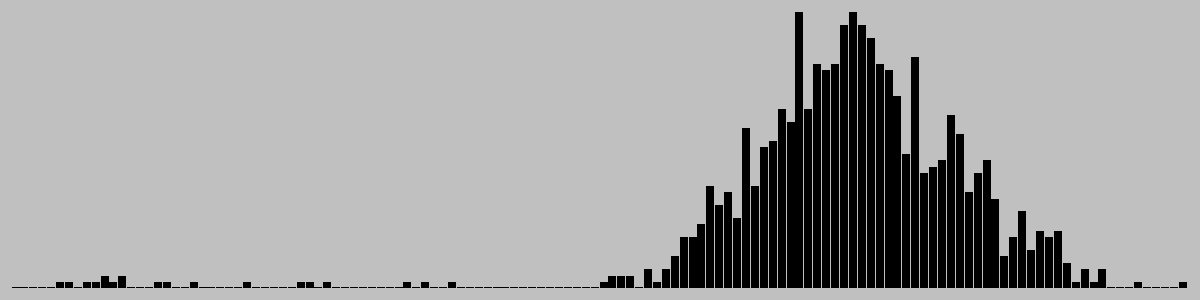
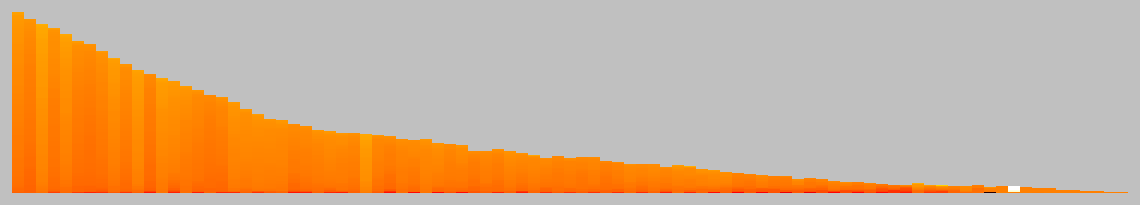
Game Length
Game length frequencies.
Mean
93.33
Mode
[88, 94]
Median
94.0
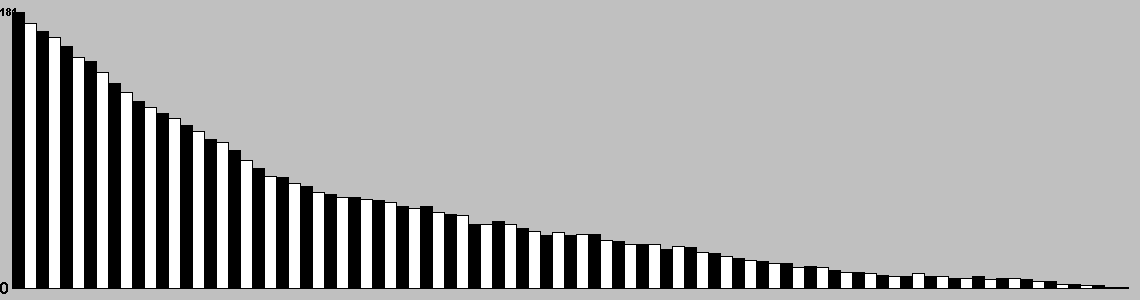
Change in Material Per Turn
This chart is based on a single representative* playout, and gives a feel for the change in material over the course of a game. (* Representative in the sense that it is close to the mean length.)
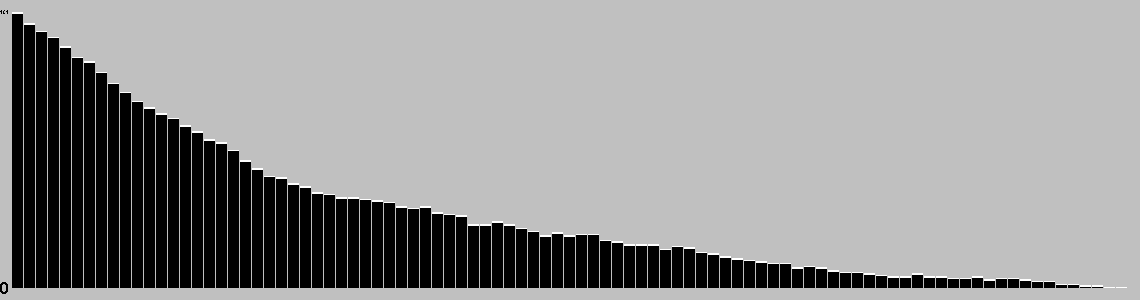
Actions/turn
Table: branching factor per turn, based on a single representative* game. (* Representative in the sense that it is close to the mean game length.)
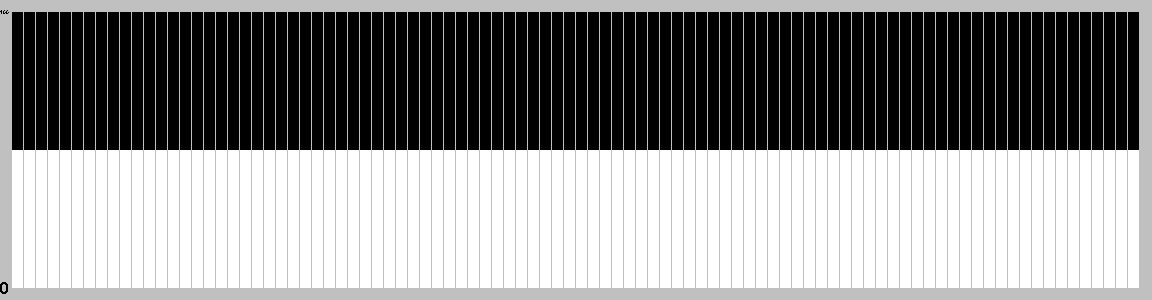
Action Types per Turn
This chart is based on a single representative* game, and gives a feel for the types of moves available throughout that game. (* Representative in the sense that it is close to the mean game length.)
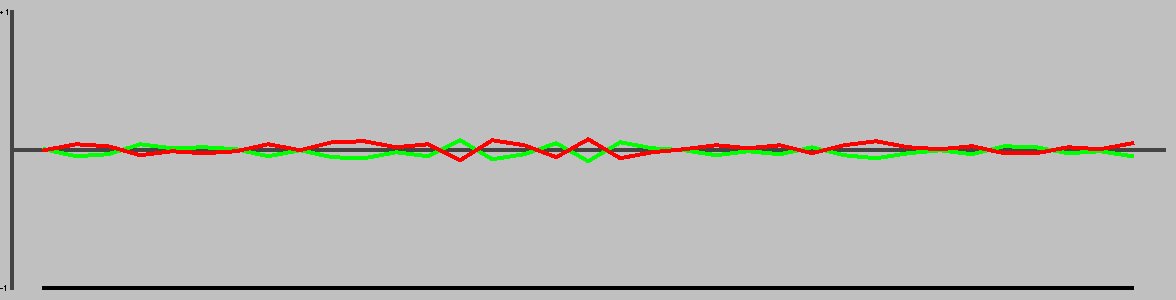
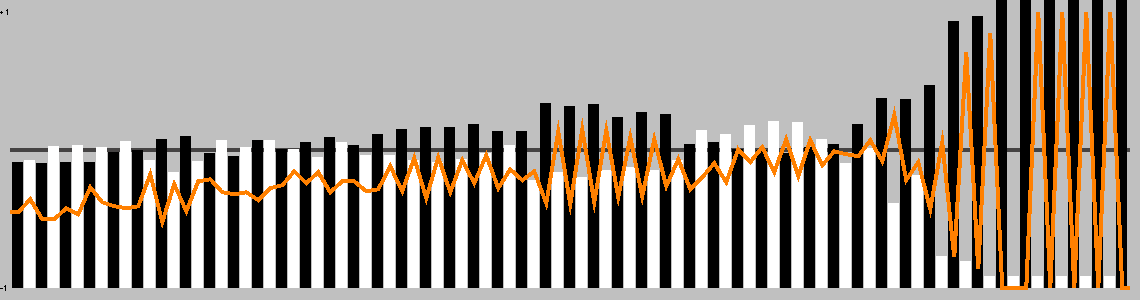
This chart shows the best move value with respect to the active player; the orange line represents the value of doing nothing (null move).
The lead changed on 31% of the game turns. Ai Ai found 5 critical turns (turns with only one good option).
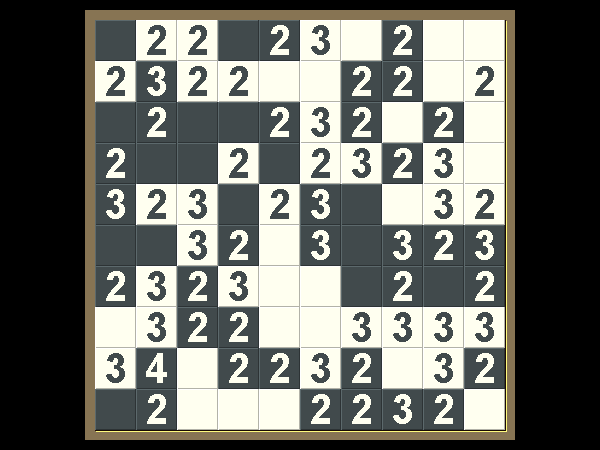
Position Heatmap
This chart shows the relative temperature of all moves each turn. Colour range: black (worst), red, orange(even), yellow, white(best).
Good/Effective moves
Measure
All players
Player 1
Player 2
Mean % of effective moves
24.14
20.40
27.80
Mean no. of effective moves
2.96
2.78
3.13
Effective game space
10^31.96
10^14.78
10^17.18
Mean % of good moves
17.10
30.60
3.89
Mean no. of good moves
2.95
5.26
0.68
Good move game space
10^23.14
10^19.13
10^4.00
These figures were calculated over a single game.
An effective move is one with score 0.1 of the best move (including the best move). -1 (loss) <= score <= 1 (win)
A good move has a score > 0. Note that when there are no good moves, an multiplier of 1 is used for the game space calculation.
Quality Measures
Measure
Value
Description
Hot turns
80.65%
A hot turn is one where making a move is better than doing nothing.
Momentum
25.81%
% of turns where a player improved their score.
Correction
41.94%
% of turns where the score headed back towards equality.
Depth
4.74%
Difference in evaluation between a short and long search.
Drama
0.46%
How much the winner was behind before their final victory.
Foulup Factor
21.51%
Moves that looked better than the best move after a short search.
Surprising turns
2.15%
Turns that looked bad after a short search, but good after a long one.
Last lead change
75.27%
Distance through game when the lead changed for the last time.
Decisiveness
12.90%
Distance from the result being known to the end of the game.
These figures were calculated over a single representative* game, and based on the measures of quality described in "Automatic Generation and Evaluation of Recombination Games" (Cameron Browne, 2007). (* Representative, in the sense that it is close to the mean game length.)
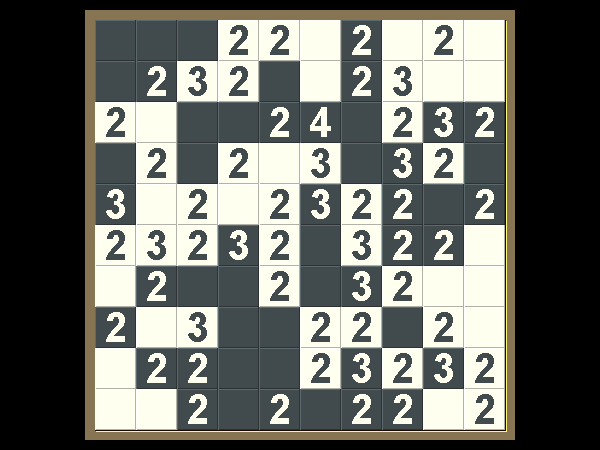
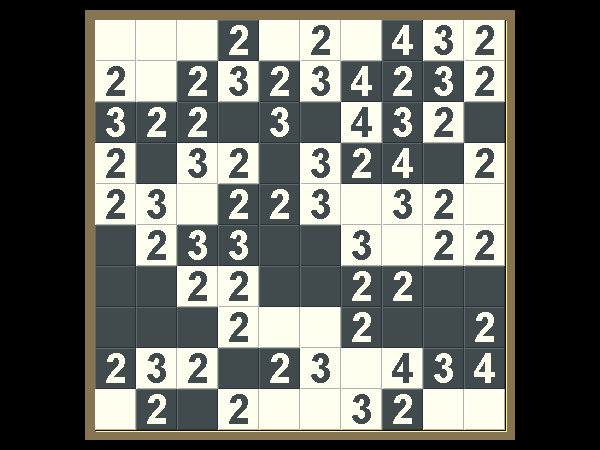
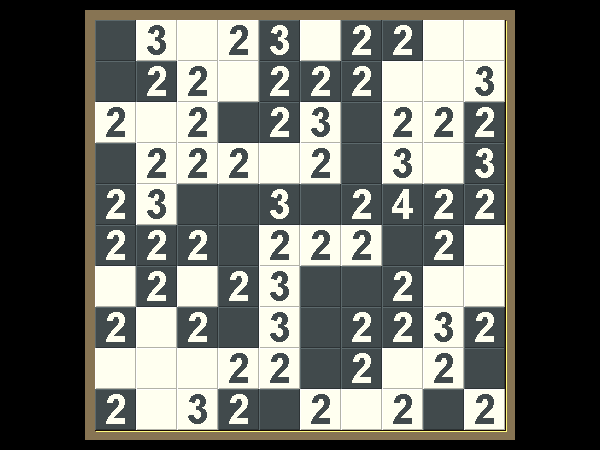
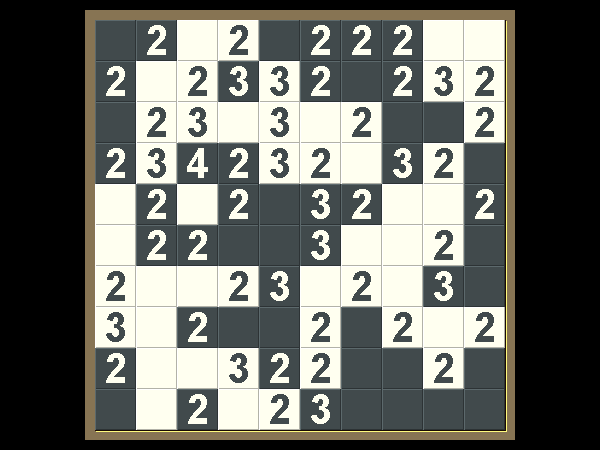
Opening Heatmap
Colour shows the success ratio of this play over the first 10moves; black < red < yellow < white.
Size shows the frequency this move is played.
Unique Positions Reachable at Depth
0
1
2
3
1
180
31432
2634956
Note: most games do not take board rotation and reflection into consideration. Multi-part turns could be treated as the same or different depth depending on the implementation. Counts to depth N include all moves reachable at lower depths. Inaccuracies may also exist due to hash collisions, but Ai Ai uses 64-bit hashes so these will be a very small fraction of a percentage point.
Shortest Game(s)
No solutions found to depth 3.
Puzzles
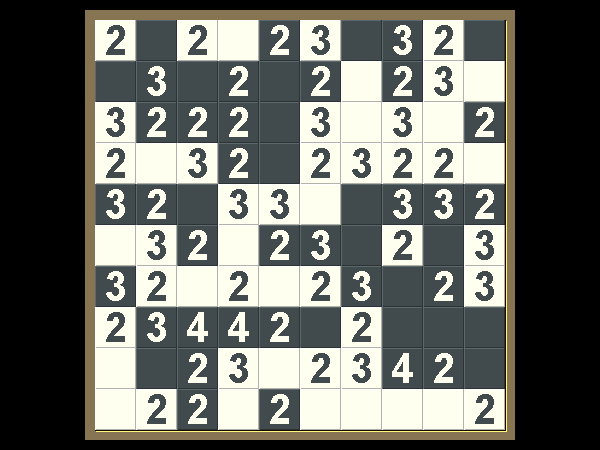
Puzzle
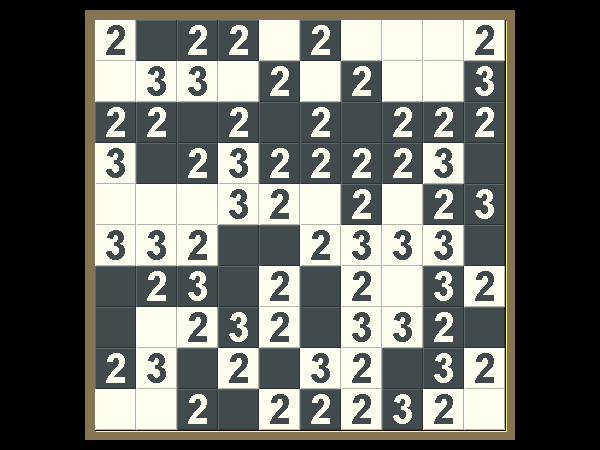
Solution
Black to win in 19 moves
White to win in 20 moves
Black to win in 19 moves
Black to win in 18 moves
White to win in 19 moves
Black to win in 18 moves
White to win in 17 moves
Black to win in 14 moves
Black to win in 16 moves
White to win in 14 moves
White to win in 16 moves
Black to win in 15 moves
Black to win in 14 moves
Black to win in 15 moves
White to win in 10 moves
Black to win in 8 moves
Black to win in 13 moves
Black to win in 15 moves
Black to win in 10 moves
White to win in 12 moves
Black to win in 10 moves
Black to win in 13 moves
Black to win in 12 moves
Black to win in 7 moves
White to win in 7 moves
White to win in 6 moves
Black to win in 5 moves
Weak puzzle selection criteria are in place; the first move may not be unique.