Ai Ai calculates the size of the implementation, and compares it to the Ai Ai implementation of the simplest possible game (which just fills the board). Note that this estimate may include some graphics and heuristics code as well as the game logic. See the wikipedia entry for more details.
Playout Complexity Estimate
Playouts per second
126555.05 (7.90µs/playout)
Reference Size
1830831.20 (0.55µs/playout)
Ratio (low is good)
14.47
Tavener complexity: the heat generated by playing every possible instance of a game with a perfectly efficient programme. Since this is not possible to calculate, Ai Ai calculates the number of random playouts per second and compares it to the fastest non-trivial Ai Ai game (Connect 4). This ratio gives a practical indication of how complex the game is. Combine this with the computational state space, and you can get an idea of how strong the default (MCTS-based) AI will be.
State Space Complexity
% new positions/bucket
State Space Complexity
1370205
State Space Complexity (log 10)
6.14
Confidence
98.88
0: totally unreliable, 100: perfect
Samples
1159755
State space complexity (where present) is an estimate of the number of distinct game tree reachable through actual play. Over a series of random games, Ai Ai checks each position to see if it is new, or a repeat of a previous position and keeps a total for each game. As the number of games increase, the quantity of new positions seen per game decreases. These games are then partitioned into a number of buckets, and if certain conditions are met, Ai Ai treats the number in each bucket as the start of a strictly decreasing geometric sequence and sums it to estimate the total state space. The accuracy is calculated as 1-[end bucket count]/[starting bucklet count]
Playout/Search Speed
Label
Its/s
SD
Nodes/s
SD
Game length
SD
Random playout
253,715
5,619
3,384,760
74,476
13
8
search.UCT
286,543
97,196
30
2
Random: 10 second warmup for the hotspot compiler. 100 trials of 1000ms each.
Other: 100 playouts, means calculated over the first 5 moves only to avoid distortion due to speedup at end of game.
Mirroring Strategies
Rotation (Half turn) lost each game as expected.
Reflection (X axis) lost each game as expected.
Reflection (Y axis) lost each game as expected.
Copy last move lost each game as expected.
Mirroring strategies attempt to copy the previous move. On first move, they will attempt to play in the centre. If neither of these are possible, they will pick a random move. Each entry represents a different form of copying; direct copy, reflection in either the X or Y axis, half-turn rotation.
Win % By Player (Bias)
1: White win %
79.70±2.60
Includes draws = 50%
2: Black win %
20.30±2.38
Includes draws = 50%
Draw %
26.40
Percentage of games where all players draw.
Decisive %
73.60
Percentage of games with a single winner.
Samples
1000
Quantity of logged games played
Note: that win/loss statistics may vary depending on thinking time (horizon effect, etc.), bad heuristics, bugs, and other factors, so should be taken with a pinch of salt. (Given perfect play, any game of pure skill will always end in the same result.)
Note: Ai Ai differentiates between states where all players draw or win or lose; this is mostly to support cooperative games.
UCT Skill Chains
Match
AI
Strong Wins
Draws
Strong Losses
#Games
Strong Score
p1 Win%
Draw%
p2 Win%
Game Length
0
Random
1
UCT (its=2)
620
22
342
984
0.6108 <= 0.6413 <= 0.6706
51.83
2.24
45.93
11.43
4
UCT (its=5)
630
1
367
998
0.6014 <= 0.6318 <= 0.6611
51.60
0.10
48.30
9.12
8
UCT (its=9)
631
0
350
981
0.6127 <= 0.6432 <= 0.6726
57.70
0.00
42.30
7.51
14
UCT (its=15)
631
0
368
999
0.6013 <= 0.6316 <= 0.6610
64.36
0.00
35.64
6.66
27
UCT (its=73)
631
0
105
736
0.8302 <= 0.8573 <= 0.8808
58.29
0.00
41.71
7.03
28
UCT (its=200)
577
107
128
812
0.7466 <= 0.7765 <= 0.8038
47.04
13.18
39.78
13.87
29
UCT (its=542)
321
619
60
1000
0.6001 <= 0.6305 <= 0.6599
20.20
61.90
17.90
23.27
31
UCT (its=4007)
126
874
0
1000
0.5321 <= 0.5630 <= 0.5934
6.80
87.40
5.80
27.39
32
UCT (its=4007)
2
995
3
1000
0.4686 <= 0.4995 <= 0.5304
0.50
99.50
0.00
29.89
Search for levels ended. Close to theoretical value: draw.
Level of Play: Strong beats Weak 60% of the time (lower bound with 95% confidence).
Draw%, p1 win% and game length may give some indication of trends as AI strength increases.
1st Player Win Ratios by Playing Strength
This chart shows the win(green)/draw(black)/loss(red) percentages, as UCT play strength increases. Note that for most games, the top playing strength show here will be distinctly below human standard.
Complexity
Game length
12.45
Branching factor
12.91
Complexity
10^11.26
Based on game length and branching factor
Computational Complexity
10^4.75
Sample quality (100 best): 67.40
Samples
1000
Quantity of logged games played
Computational complexity (where present) is an estimate of the game tree reachable through actual play. For each game in turn, Ai Ai marks the positions reached in a hashtable, then counts the number of new moves added to the table. Once all moves are applied, it treats this sequence as a geometric progression and calculates the sum as n-> infinity.
Move Classification
Board Size
9
Quantity of distinct board cells
Distinct actions
83
Quantity of distinct moves (e.g. "e4") regardless of position in game tree
Good moves
53
A good move is selected by the AI more than the average
Bad moves
30
A bad move is selected by the AI less than the average
Response distance%
72.78%
Distance from move to response / maximum board distance; a low value suggests a game is tactical rather than strategic.
Samples
1000
Quantity of logged games played
Board Coverage
A mean of 75.26% of board locations were used per game.
Colour and size show the frequency of visits.
Game Length
Game length frequencies.
Mean
12.18
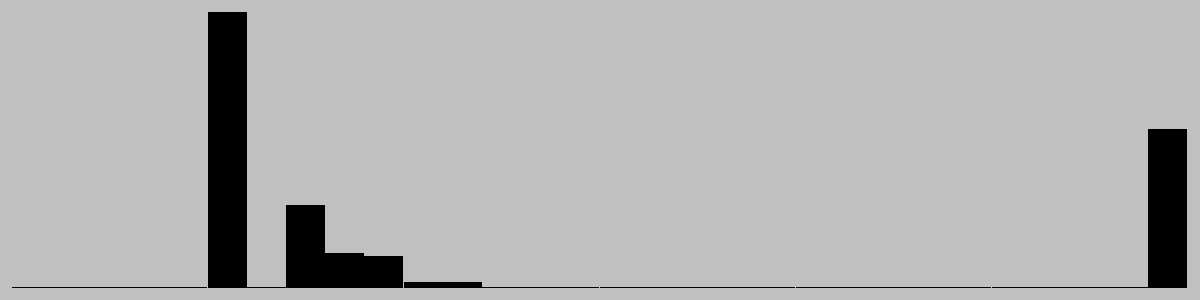
Mode
[5]
Median
7.0
Change in Material Per Turn
Mean change in material/round
0.43
Complete round of play (all players)
This chart is based on a single representative* playout, and gives a feel for the change in material over the course of a game. (* Representative in the sense that it is close to the mean length.)
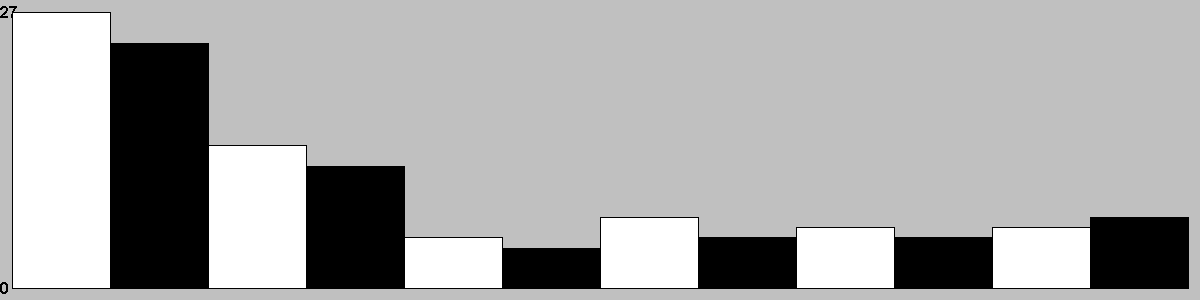
Actions/turn
Table: branching factor per turn, based on a single representative* game. (* Representative in the sense that it is close to the mean game length.)
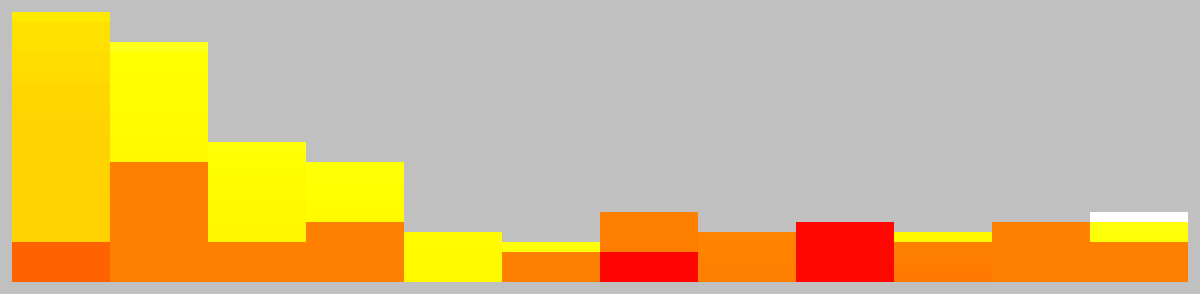
Action Types per Turn
This chart is based on a single representative* game, and gives a feel for the types of moves available throughout that game. (* Representative in the sense that it is close to the mean game length.)
This chart shows the best move value with respect to the active player; the orange line represents the value of doing nothing (null move).
The lead changed on 8% of the game turns. Ai Ai found 2 critical turns (turns with only one good option).
Position Heatmap
This chart shows the relative temperature of all moves each turn. Colour range: black (worst), red, orange(even), yellow, white(best).
Good/Effective moves
Measure
All players
Player 1
Player 2
Mean % of effective moves
50.11
75.75
24.46
Mean no. of effective moves
4.67
6.33
3.00
Effective game space
10^6.43
10^4.70
10^1.73
Mean % of good moves
26.60
3.00
50.20
Mean no. of good moves
1.83
0.50
3.17
Good move game space
10^2.95
10^0.30
10^2.65
These figures were calculated over a single game.
An effective move is one with score 0.1 of the best move (including the best move). -1 (loss) <= score <= 1 (win)
A good move has a score > 0. Note that when there are no good moves, an multiplier of 1 is used for the game space calculation.
Quality Measures
Measure
Value
Description
Hot turns
75.00%
A hot turn is one where making a move is better than doing nothing.
Momentum
16.67%
% of turns where a player improved their score.
Correction
16.67%
% of turns where the score headed back towards equality.
Depth
0.98%
Difference in evaluation between a short and long search.
Drama
0.00%
How much the winner was behind before their final victory.
Foulup Factor
33.33%
Moves that looked better than the best move after a short search.
Surprising turns
8.33%
Turns that looked bad after a short search, but good after a long one.
Last lead change
16.67%
Distance through game when the lead changed for the last time.
Decisiveness
41.67%
Distance from the result being known to the end of the game.
These figures were calculated over a single representative* game, and based on the measures of quality described in "Automatic Generation and Evaluation of Recombination Games" (Cameron Browne, 2007). (* Representative, in the sense that it is close to the mean game length.)
Openings
Moves
Animation
Ka1,Qa3,Rc2,Kc3,Qb3
Rc2,Kc3,Ka1,Qa3,Qb3
Rc2,Qa3,Ka1,Kc3,Qb3
Kb2,Rb1,Qa3,Kb3
Kc3,Qa3,Rb1,Rb3
Qa3,Rb1,Kb2,Kb3
Rb1,Qa3,Kc3,Rb3
Rb2,Qc1,Kc2,Ka3
Rc2,Qc3,Qa2,Rb1
Ka1,Qa3,Rc2,Kc3
Qc2,Qa2,Kb3,Kb1
Rc2,Kc3,Ka1,Qa3
Opening Heatmap
Colour shows the success ratio of this play over the first 10moves; black < red < yellow < white.
Size shows the frequency this move is played.
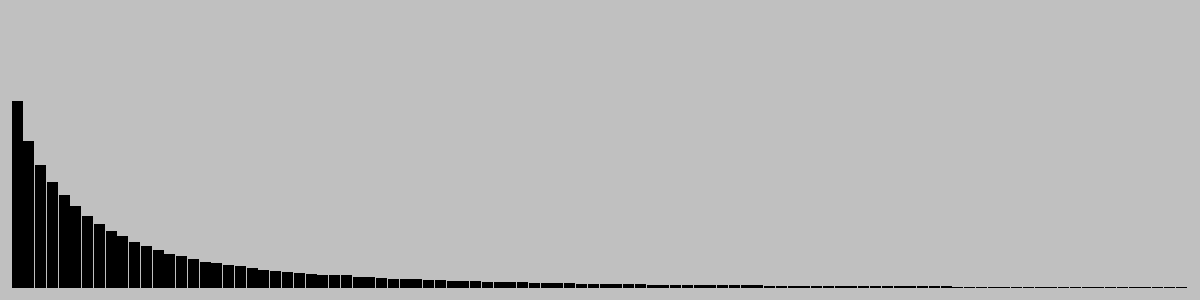
Unique Positions Reachable at Depth
0
1
2
3
4
5
6
7
8
9
10
11
12
13
14
15
16
17
18
19
20
21
22
23
24
25
26
27
28
29
30
1
27
675
5211
32427
77787
138267
198747
259227
319707
380187
440667
501147
561627
622107
682587
743067
803547
864027
924507
984987
1045467
1105947
1166427
1226907
1287387
1347867
1408347
1468827
1529307
1589787
Note: most games do not take board rotation and reflection into consideration. Multi-part turns could be treated as the same or different depth depending on the implementation. Counts to depth N include all moves reachable at lower depths. Inaccuracies may also exist due to hash collisions, but Ai Ai uses 64-bit hashes so these will be a very small fraction of a percentage point.
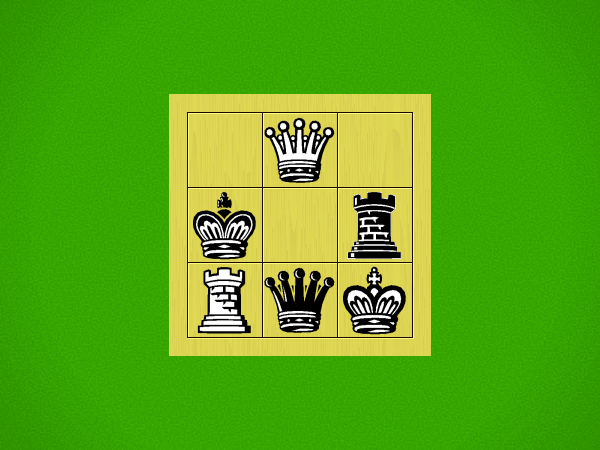
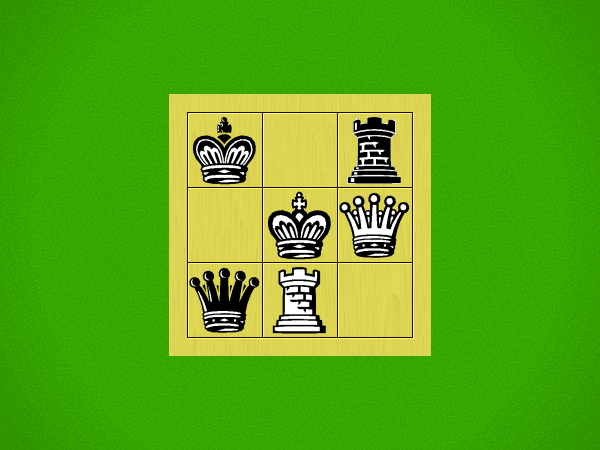
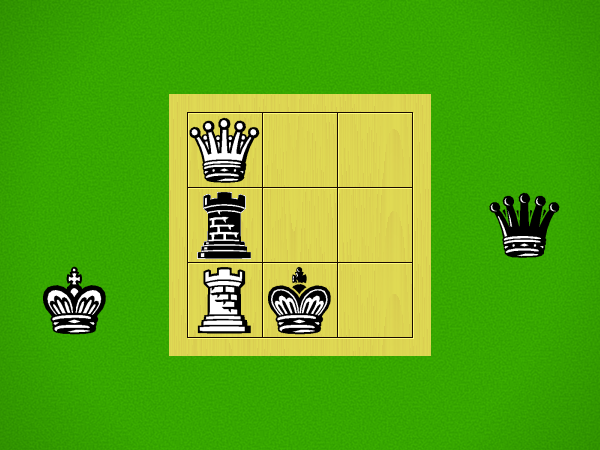
Shortest Game(s)
4320 solutions found at depth 5.
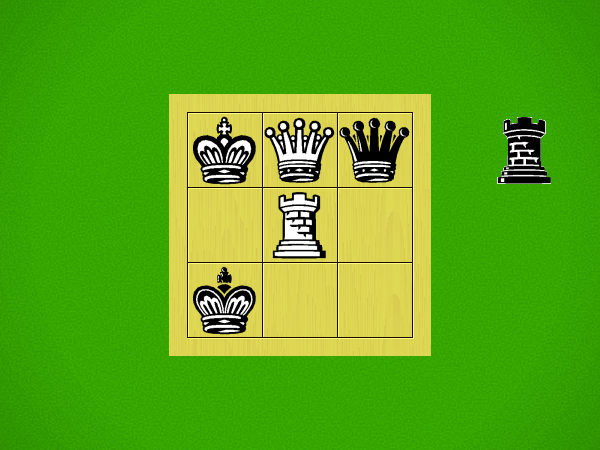
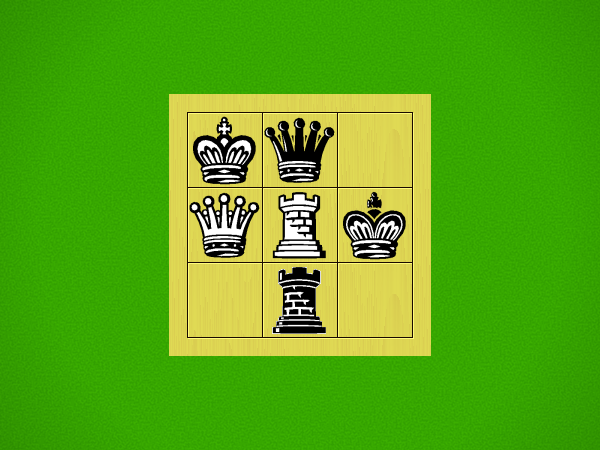
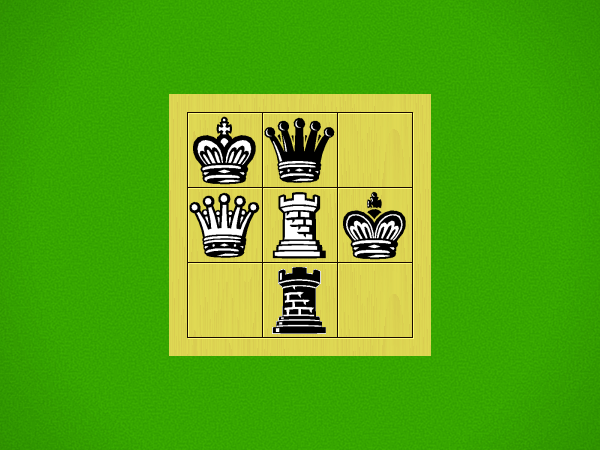
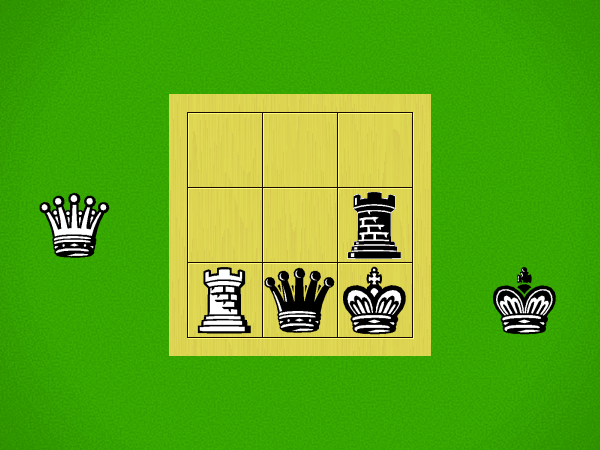
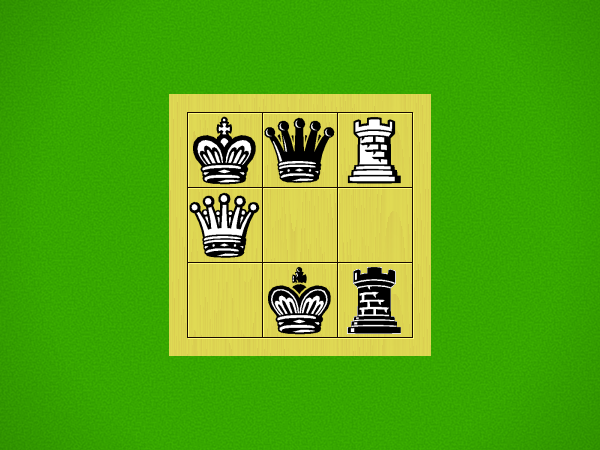
Puzzles
Puzzle
Solution
White to win in 3 moves
Black to win in 3 moves
Black to win in 3 moves
White to win in 3 moves
White to win in 3 moves
White to win in 3 moves
White to win in 3 moves
Black to win in 3 moves
Weak puzzle selection criteria are in place; the first move may not be unique.