Ai Ai calculates the size of the implementation, and compares it to the Ai Ai implementation of the simplest possible game (which just fills the board). Note that this estimate may include some graphics and heuristics code as well as the game logic. See the wikipedia entry for more details.
Playout Complexity Estimate
Playouts per second
92137.88 (10.85µs/playout)
Reference Size
557320.40 (1.79µs/playout)
Ratio (low is good)
6.05
Tavener complexity: the heat generated by playing every possible instance of a game with a perfectly efficient programme. Since this is not possible to calculate, Ai Ai calculates the number of random playouts per second and compares it to the fastest non-trivial Ai Ai game (Connect 4). This ratio gives a practical indication of how complex the game is. Combine this with the computational state space, and you can get an idea of how strong the default (MCTS-based) AI will be.
State Space Complexity
% new positions/bucket
State Space Complexity
67108019
State Space Complexity bounds
64154612 < 67108019 < ∞
State Space Complexity (log 10)
7.83
State Space Complexity bounds (log 10)
7.81 <= 7.83 <= ∞
Samples
1316368
Confidence
0.00
0: totally unreliable, 100: perfect
State space complexity (where present) is an estimate of the number of distinct game tree reachable through actual play. Over a series of random games, Ai Ai checks each position to see if it is new, or a repeat of a previous position and keeps a total for each game. As the number of games increase, the quantity of new positions seen per game decreases. These games are then partitioned into a number of buckets, and if certain conditions are met, Ai Ai treats the number in each bucket as the start of a strictly decreasing geometric sequence and sums it to estimate the total state space. The accuracy is calculated as 1-[end bucket count]/[starting bucklet count]
Playout/Search Speed
Label
Its/s
SD
Nodes/s
SD
Game length
SD
Random playout
119,019
441
6,269,487
22,741
53
8
search.UCT
60,749
2,311
59
9
Random: 10 second warmup for the hotspot compiler. 100 trials of 1000ms each.
Other: 100 playouts, means calculated over the first 5 moves only to avoid distortion due to speedup at end of game.
Mirroring Strategies
Rotation (Half turn) lost each game as expected.
Reflection (X axis) lost each game as expected.
Reflection (Y axis) lost each game as expected.
Copy last move lost each game as expected.
Mirroring strategies attempt to copy the previous move. On first move, they will attempt to play in the centre. If neither of these are possible, they will pick a random move. Each entry represents a different form of copying; direct copy, reflection in either the X or Y axis, half-turn rotation.
Win % By Player (Bias)
1: Player 1 win %
33.40±2.85
Includes draws = 50%
2: Player 2 win %
66.60±2.98
Includes draws = 50%
Draw %
0.00
Percentage of games where all players draw.
Decisive %
100.00
Percentage of games with a single winner.
Samples
1000
Quantity of logged games played
Note: that win/loss statistics may vary depending on thinking time (horizon effect, etc.), bad heuristics, bugs, and other factors, so should be taken with a pinch of salt. (Given perfect play, any game of pure skill will always end in the same result.)
Note: Ai Ai differentiates between states where all players draw or win or lose; this is mostly to support cooperative games.
UCT Skill Chains
Match
AI
Strong Wins
Draws
Strong Losses
#Games
Strong Score
p1 Win%
Draw%
p2 Win%
Game Length
0
Random
1
UCT (its=2)
631
0
281
912
0.6612 <= 0.6919 <= 0.7210
34.54
0.00
65.46
52.14
14
UCT (its=15)
631
0
327
958
0.6281 <= 0.6587 <= 0.6880
25.47
0.00
74.53
51.51
23
UCT (its=24)
631
0
354
985
0.6102 <= 0.6406 <= 0.6700
24.57
0.00
75.43
51.99
42
UCT (its=43)
631
0
346
977
0.6153 <= 0.6459 <= 0.6752
19.65
0.00
80.35
53.55
65
UCT (its=9053)
522
0
472
994
0.4941 <= 0.5252 <= 0.5560
2.52
0.00
97.48
55.65
66
UCT (its=9053)
504
0
496
1000
0.4731 <= 0.5040 <= 0.5349
2.00
0.00
98.00
61.50
Search for levels ended. Close to theoretical value: player 2 wins.
Level of Play: Strong beats Weak 60% of the time (lower bound with 95% confidence).
Draw%, p1 win% and game length may give some indication of trends as AI strength increases.
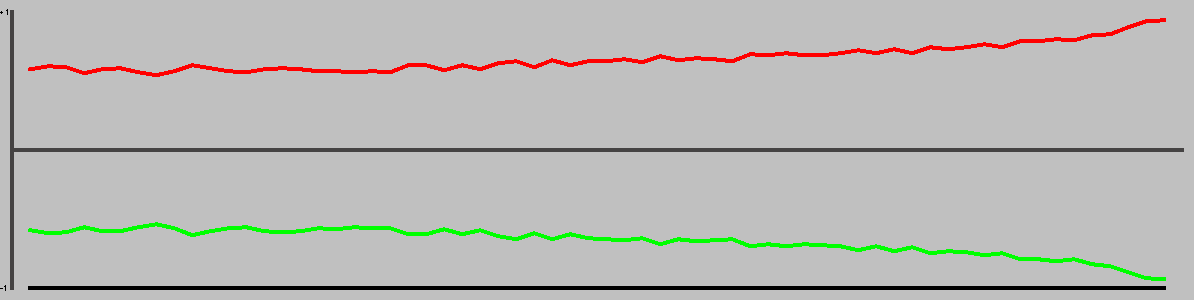
1st Player Win Ratios by Playing Strength
This chart shows the win(green)/draw(black)/loss(red) percentages, as UCT play strength increases. Note that for most games, the top playing strength show here will be distinctly below human standard.
Complexity
Game length
32.61
Branching factor
45.15
Complexity
10^52.46
Based on game length and branching factor
Computational Complexity
10^6.74
Sample quality (100 best): 27.21
Samples
1000
Quantity of logged games played
Computational complexity (where present) is an estimate of the game tree reachable through actual play. For each game in turn, Ai Ai marks the positions reached in a hashtable, then counts the number of new moves added to the table. Once all moves are applied, it treats this sequence as a geometric progression and calculates the sum as n-> infinity.
Move Classification
Board Size
61
Quantity of distinct board cells
Distinct actions
64
Quantity of distinct moves (e.g. "e4") regardless of position in game tree
Killer moves
1
A 'killer' move is selected by the AI more than 50% of the time Killers: Choose White (Divide)
Good moves
39
A good move is selected by the AI more than the average
Bad moves
25
A bad move is selected by the AI less than the average
Response distance%
34.91%
Distance from move to response / maximum board distance; a low value suggests a game is tactical rather than strategic.
Samples
1000
Quantity of logged games played
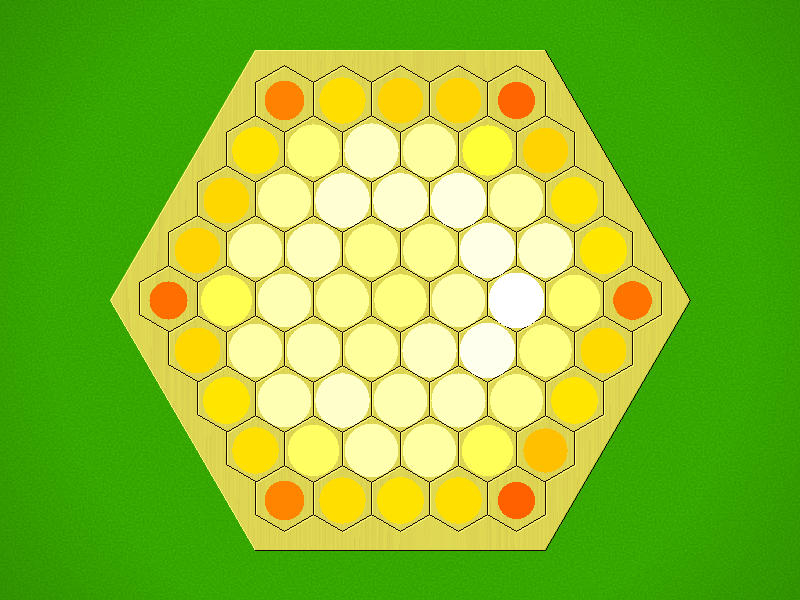
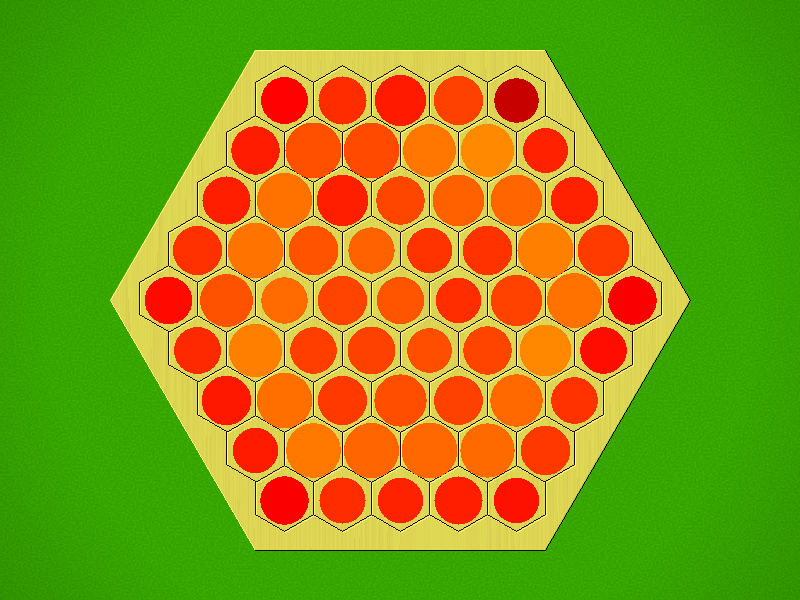
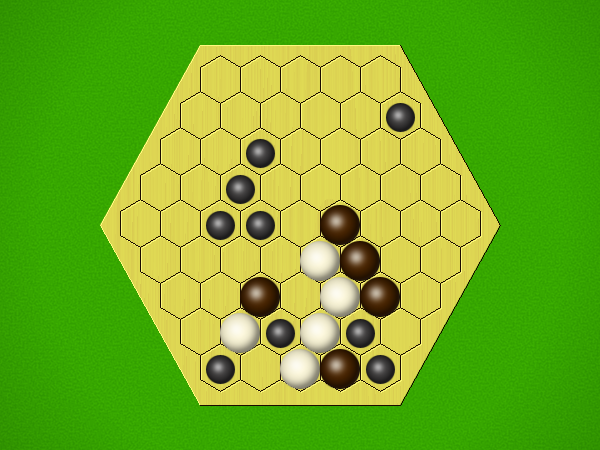
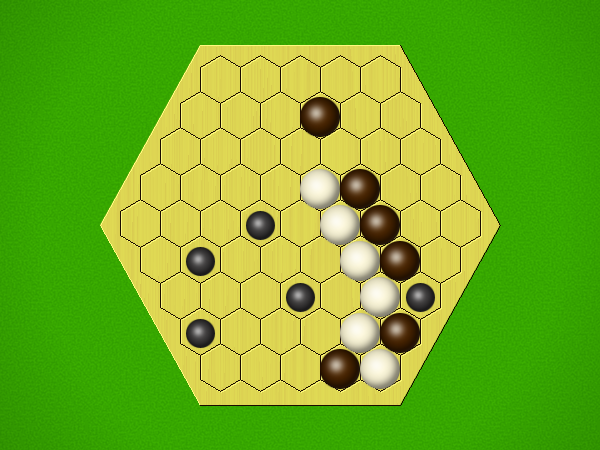
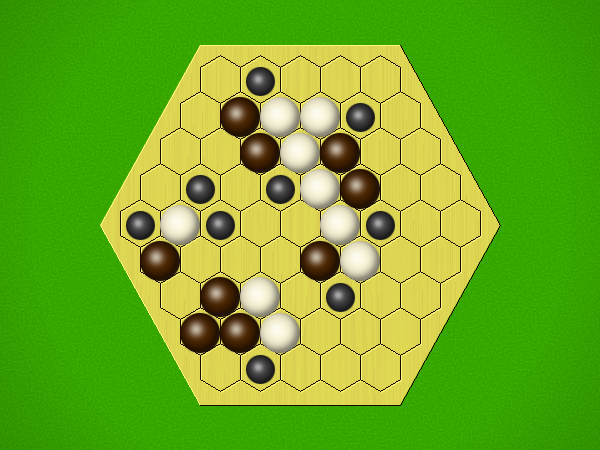
Board Coverage
A mean of 50.17% of board locations were used per game.
Colour and size show the frequency of visits.
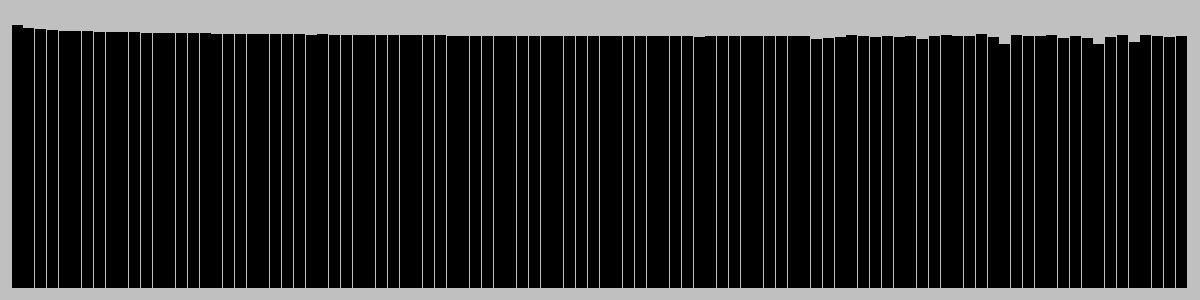
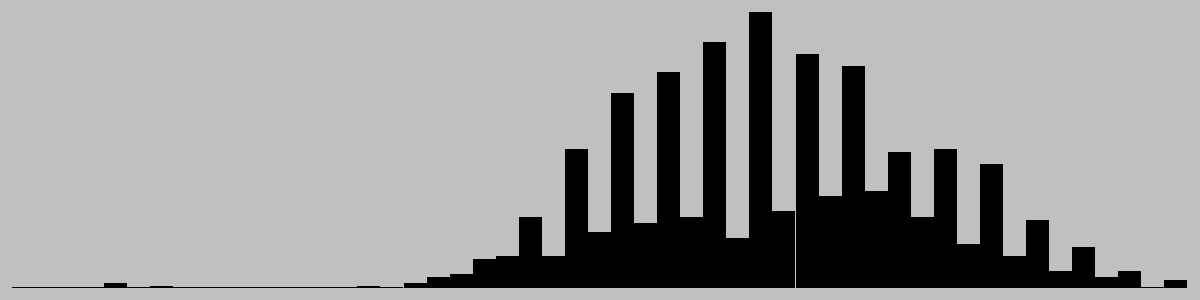
Game Length
Game length frequencies.
Mean
32.61
Mode
[32]
Median
32.0
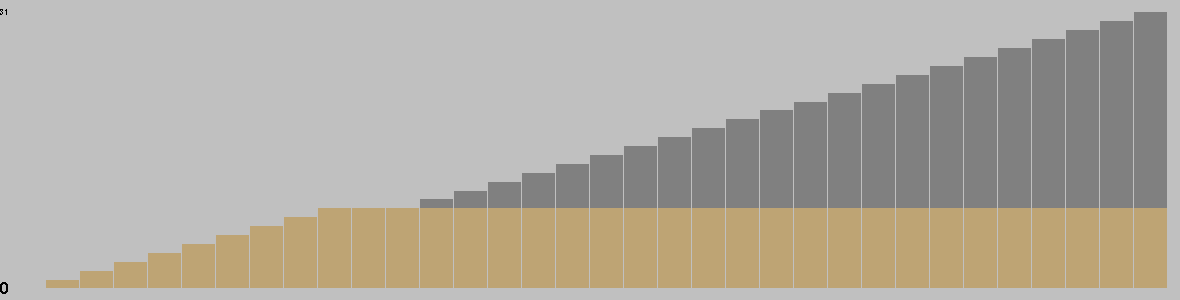
Change in Material Per Turn
Mean change in material/round
0.85
Complete round of play (all players)
This chart is based on a single representative* playout, and gives a feel for the change in material over the course of a game. (* Representative in the sense that it is close to the mean length.)
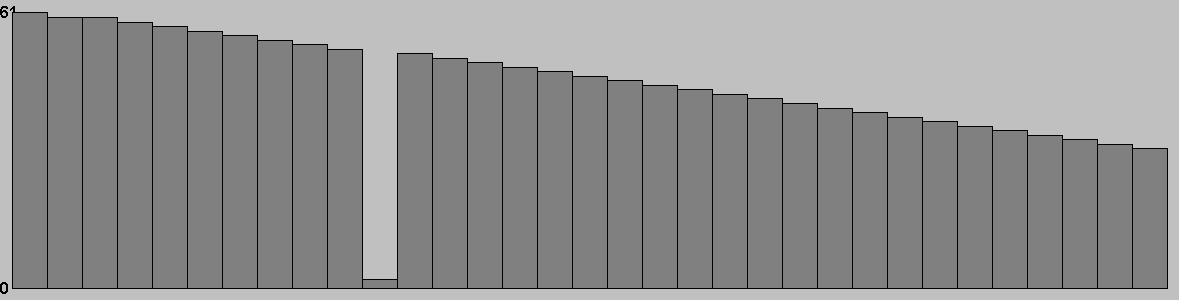
Actions/turn
Table: branching factor per turn, based on a single representative* game. (* Representative in the sense that it is close to the mean game length.)
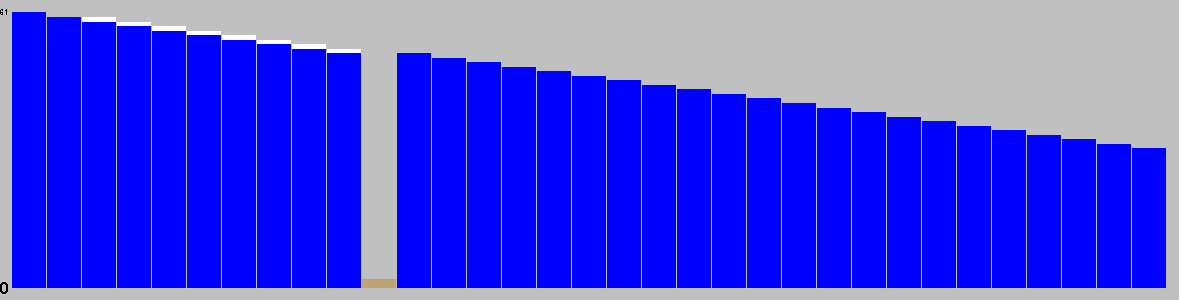
Action Types per Turn
This chart is based on a single representative* game, and gives a feel for the types of moves available throughout that game. (* Representative in the sense that it is close to the mean game length.)
Colour shows the success ratio of this play over the first 10moves; black < red < yellow < white.
Size shows the frequency this move is played.
Unique Positions Reachable at Depth
0
1
2
3
4
5
1
61
1891
37881
559736
6508883
Note: most games do not take board rotation and reflection into consideration. Multi-part turns could be treated as the same or different depth depending on the implementation. Counts to depth N include all moves reachable at lower depths. Inaccuracies may also exist due to hash collisions, but Ai Ai uses 64-bit hashes so these will be a very small fraction of a percentage point.
Shortest Game(s)
No solutions found to depth 5.
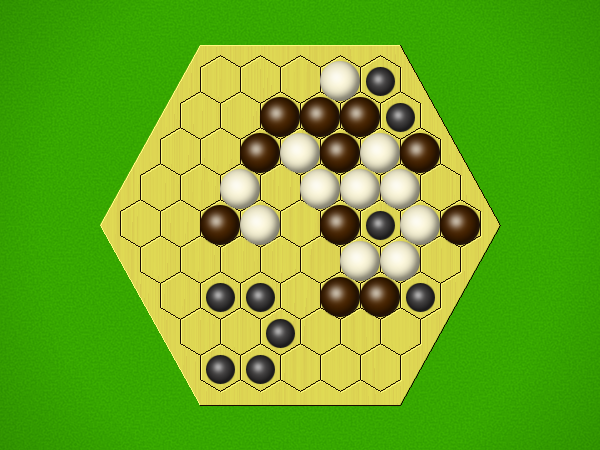
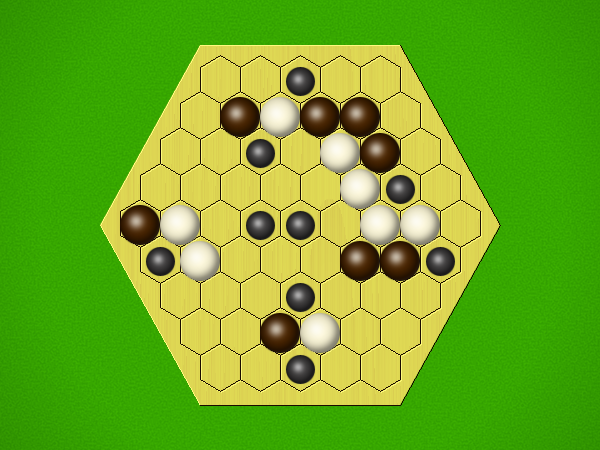
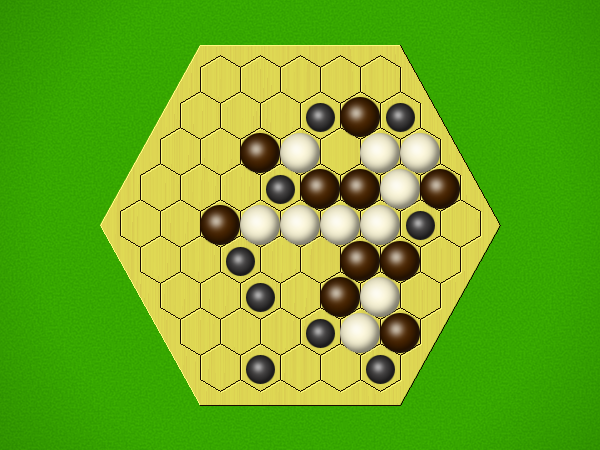
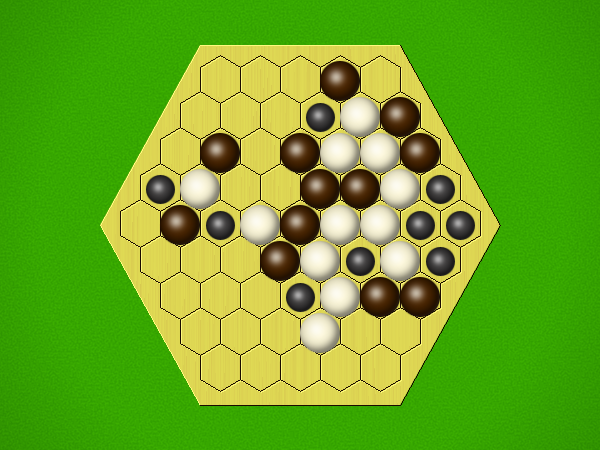
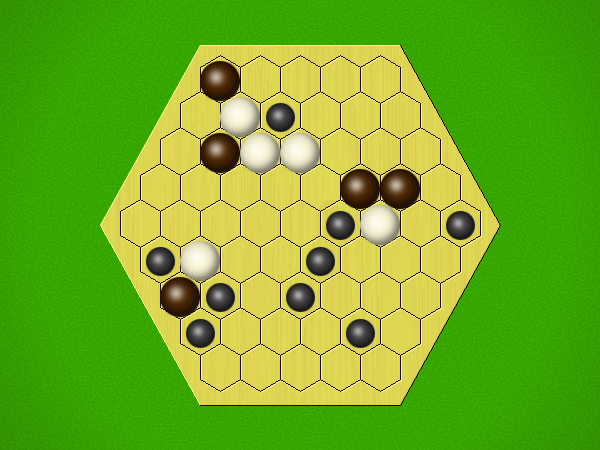
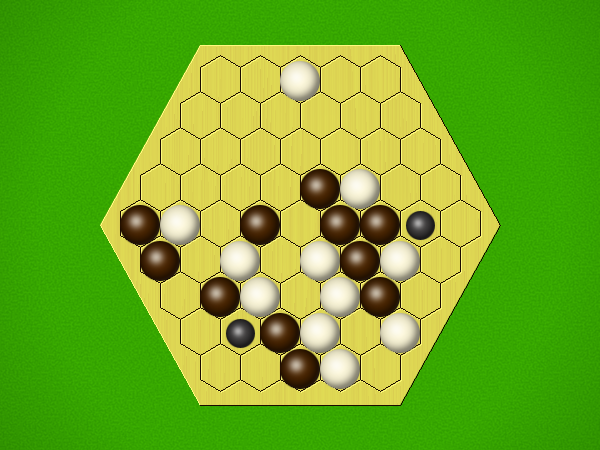
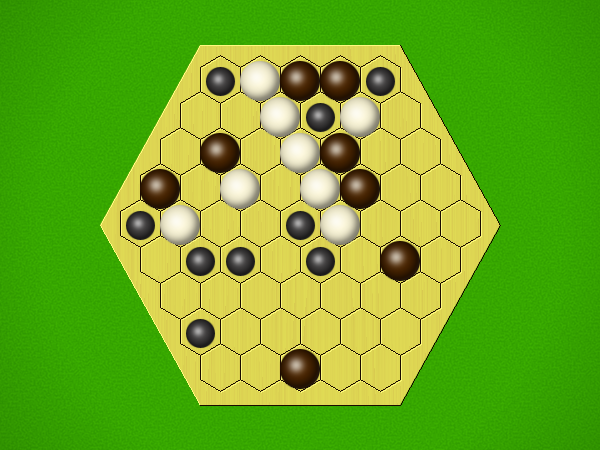
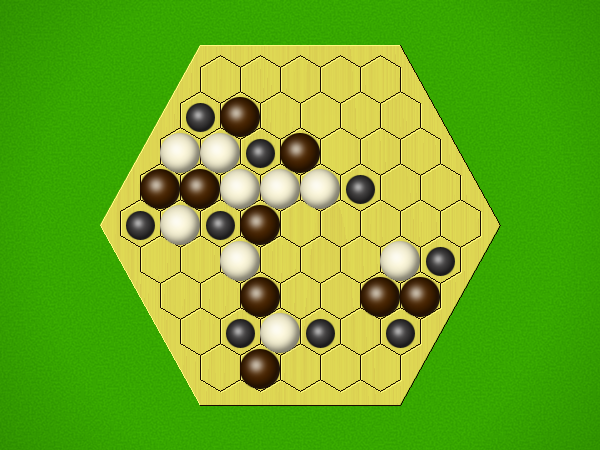
Puzzles
Puzzle
Solution
Player 2/Divide/White to win in 11 moves
Player 2/Divide/White to win in 9 moves
Player 2/Divide/White to win in 9 moves
Player 2/Divide/White to win in 7 moves
Player 1/Divide/White to win in 7 moves
Player 1/Divide/White to win in 3 moves
Player 1/Divide/White to win in 5 moves
Player 2/Divide/White to win in 5 moves
Player 1/Divide/White to win in 5 moves
Player 2/Divide/White to win in 5 moves
Player 2/Divide/White to win in 5 moves
Player 2/Divide/White to win in 5 moves
Weak puzzle selection criteria are in place; the first move may not be unique.