In WaldMeister, you want to shape the forest to suit your own ends.
Generated at 2023-06-23, 05:19 from 1000 logged games.
Rules
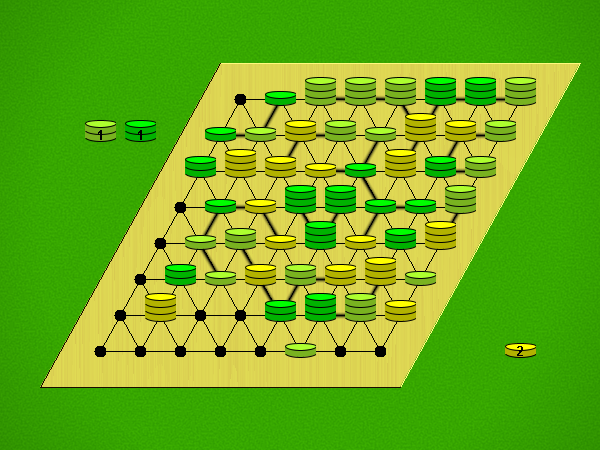
Representative game (in the sense of being of mean length). Wherever you see the 'representative game' referred to in later sections, this is it!
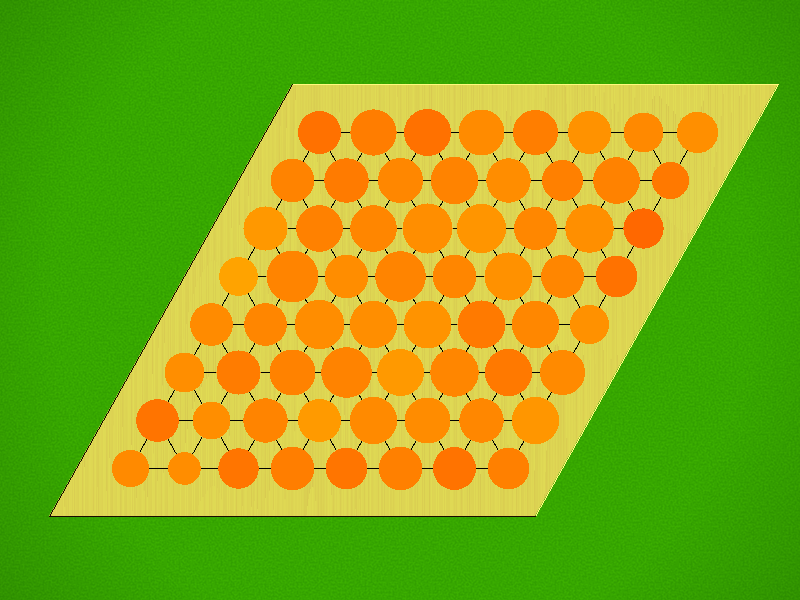
Each player starts the game with 27 pegs, with the pegs coming in three heights and three colors, and with three pegs of each combination, e.g., short and yellow-green.
Players take turns moving and placing pegs on the game board, with one player trying to create clusters according to height while the other wants clusters according to color.
To begin, the first player places one of their pegs in a hole on the game board. On each subsequent turn, the active player chooses any peg on the game board, moves it in a straight line as far as they wish to a new empty hole (not jumping any pegs), then places a peg from their reserve in the hole just vacated.
Once all the pegs have been placed, each player counts the number of pegs in each type of cluster they score, whether short/medium/tall or yellow-green/leaf-green/dark green. The player with the higher sum wins.
WaldMeister plays well with 6house (3 colors) Looney Pyramids on a hand-drawn board, which requires two 8.5x11" sheets.
iMisut
7.5
greengow
10
HCS_Elessar
8.3
rseater
8
A neat game about a forest growing and spreading. Seems pretty balanced between first and second player.
Jimalb
10
gabeschw
7
Francesco2018
10
Superb strategic Game. Love the Artwork and the straight Forward actions. On top the magnificent Production Design and Quality of Gerhards Spiel
fushiba
8.5
sebert
8
panoptiko
5
Impy
8
at010
8
Dawaran
7
master_tactician
7
jmathias
7
MissDTTV
6
mexo
N/A
Pat; hv48
qswanger
N/A
This has a lot in common with Aqualin
Kolomogorov Complexity Analysis
Size (bytes)
29683
Reference Size
10673
Ratio
2.78
Ai Ai calculates the size of the implementation, and compares it to the Ai Ai implementation of the simplest possible game (which just fills the board). Note that this estimate may include some graphics and heuristics code as well as the game logic. See the wikipedia entry for more details.
Playout Complexity Estimate
Playouts per second
12581.12 (79.48µs/playout)
Reference Size
575771.53 (1.74µs/playout)
Ratio (low is good)
45.76
Tavener complexity: the heat generated by playing every possible instance of a game with a perfectly efficient programme. Since this is not possible to calculate, Ai Ai calculates the number of random playouts per second and compares it to the fastest non-trivial Ai Ai game (Connect 4). This ratio gives a practical indication of how complex the game is. Combine this with the computational state space, and you can get an idea of how strong the default (MCTS-based) AI will be.
State Space Complexity
% new positions/bucket
State Space Complexity
80676666
State Space Complexity bounds
64911284 < 80676666 < ∞
State Space Complexity (log 10)
7.91
State Space Complexity bounds (log 10)
7.81 <= 7.91 <= ∞
Samples
618986
Confidence
0.00
0: totally unreliable, 100: perfect
State space complexity (where present) is an estimate of the number of distinct game tree reachable through actual play. Over a series of random games, Ai Ai checks each position to see if it is new, or a repeat of a previous position and keeps a total for each game. As the number of games increase, the quantity of new positions seen per game decreases. These games are then partitioned into a number of buckets, and if certain conditions are met, Ai Ai treats the number in each bucket as the start of a strictly decreasing geometric sequence and sums it to estimate the total state space. The accuracy is calculated as 1-[end bucket count]/[starting bucklet count]
Playout/Search Speed
Label
Its/s
SD
Nodes/s
SD
Game length
SD
Random playout
14,547
25
1,556,550
2,704
107
0
search.UCT
14,919
367
107
0
Random: 10 second warmup for the hotspot compiler. 100 trials of 1000ms each.
Other: 100 playouts, means calculated over the first 5 moves only to avoid distortion due to speedup at end of game.
Mirroring Strategies
Rotation (Half turn) lost each game as expected.
Reflection (X axis) lost each game as expected.
Reflection (Y axis) lost each game as expected.
Copy last move lost each game as expected.
Mirroring strategies attempt to copy the previous move. On first move, they will attempt to play in the centre. If neither of these are possible, they will pick a random move. Each entry represents a different form of copying; direct copy, reflection in either the X or Y axis, half-turn rotation.
Win % By Player (Bias)
1: Heights win %
36.25±2.92
Includes draws = 50%
2: Colours win %
63.75±3.03
Includes draws = 50%
Draw %
9.30
Percentage of games where all players draw.
Decisive %
90.70
Percentage of games with a single winner.
Samples
1000
Quantity of logged games played
Note: that win/loss statistics may vary depending on thinking time (horizon effect, etc.), bad heuristics, bugs, and other factors, so should be taken with a pinch of salt. (Given perfect play, any game of pure skill will always end in the same result.)
Note: Ai Ai differentiates between states where all players draw or win or lose; this is mostly to support cooperative games.
UCT Skill Chains
Match
AI
Strong Wins
Draws
Strong Losses
#Games
Strong Score
p1 Win%
Draw%
p2 Win%
Game Length
0
Random
1
UCT (its=2)
598
65
312
975
0.6161 <= 0.6467 <= 0.6760
47.08
6.67
46.26
107.00
4
UCT (its=5)
592
78
306
976
0.6160 <= 0.6465 <= 0.6759
39.45
7.99
52.56
107.00
11
UCT (its=12)
589
83
319
991
0.6058 <= 0.6362 <= 0.6656
27.25
8.38
64.38
107.00
37
UCT (its=38)
588
86
310
984
0.6108 <= 0.6413 <= 0.6706
19.31
8.74
71.95
107.00
45
UCT (its=46)
491
69
440
1000
0.4945 <= 0.5255 <= 0.5563
13.90
6.90
79.20
107.00
46
UCT (its=46)
462
61
477
1000
0.4616 <= 0.4925 <= 0.5235
10.60
6.10
83.30
107.00
Search for levels ended. Close to theoretical value: player 2 wins.
Level of Play: Strong beats Weak 60% of the time (lower bound with 95% confidence).
Draw%, p1 win% and game length may give some indication of trends as AI strength increases.
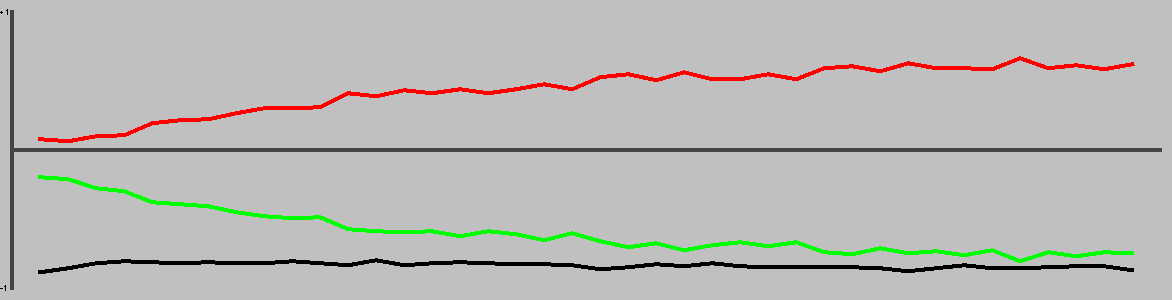
1st Player Win Ratios by Playing Strength
This chart shows the win(green)/draw(black)/loss(red) percentages, as UCT play strength increases. Note that for most games, the top playing strength show here will be distinctly below human standard.
Complexity
Game length
107.00
Branching factor
53.05
Complexity
10^143.82
Based on game length and branching factor
Computational Complexity
10^7.54
Sample quality (100 best): 3.53
Samples
1000
Quantity of logged games played
Computational complexity (where present) is an estimate of the game tree reachable through actual play. For each game in turn, Ai Ai marks the positions reached in a hashtable, then counts the number of new moves added to the table. Once all moves are applied, it treats this sequence as a geometric progression and calculates the sum as n-> infinity.
Move Classification
Board Size
64
Quantity of distinct board cells
Distinct actions
1752
Quantity of distinct moves (e.g. "e4") regardless of position in game tree
Good moves
596
A good move is selected by the AI more than the average
Bad moves
1156
A bad move is selected by the AI less than the average
Response distance%
18.87%
Distance from move to response / maximum board distance; a low value suggests a game is tactical rather than strategic.
Samples
1000
Quantity of logged games played
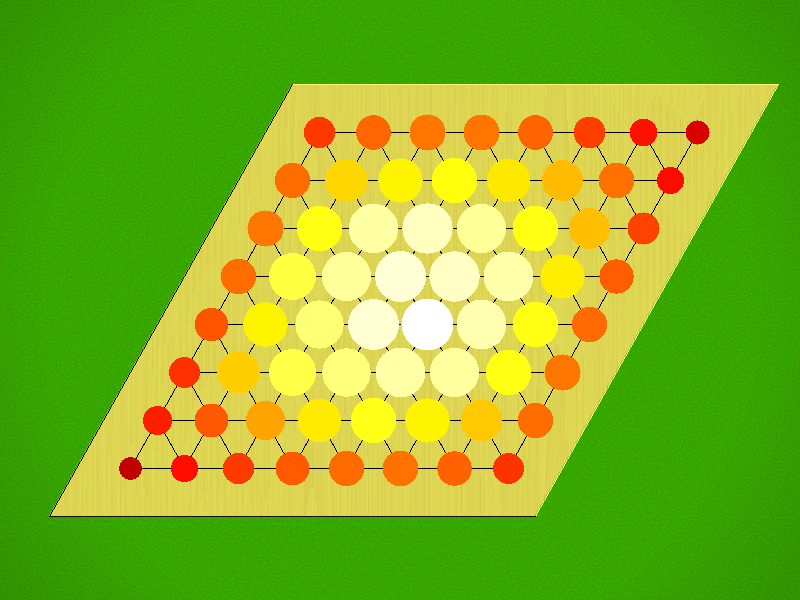
Board Coverage
A mean of 84.38% of board locations were used per game.
Colour and size show the frequency of visits.
Game Length
Game length frequencies.
Mean
107.00
Mode
[107]
Median
107.0
Change in Material Per Turn
Mean change in material/round
0.00
Complete round of play (all players)
This chart is based on a single representative* playout, and gives a feel for the change in material over the course of a game. (* Representative in the sense that it is close to the mean length.)
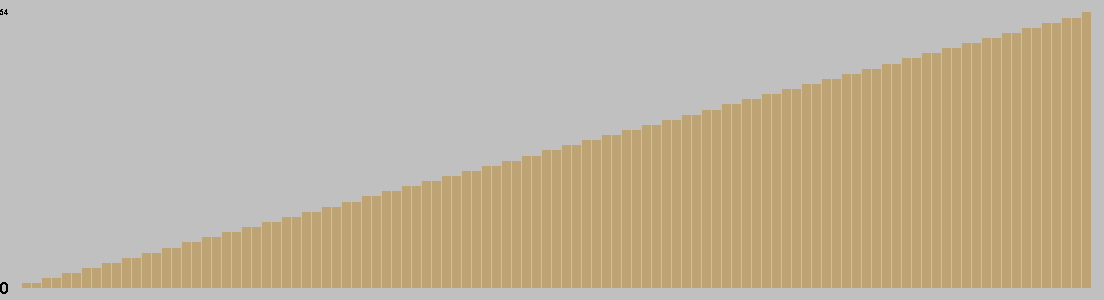
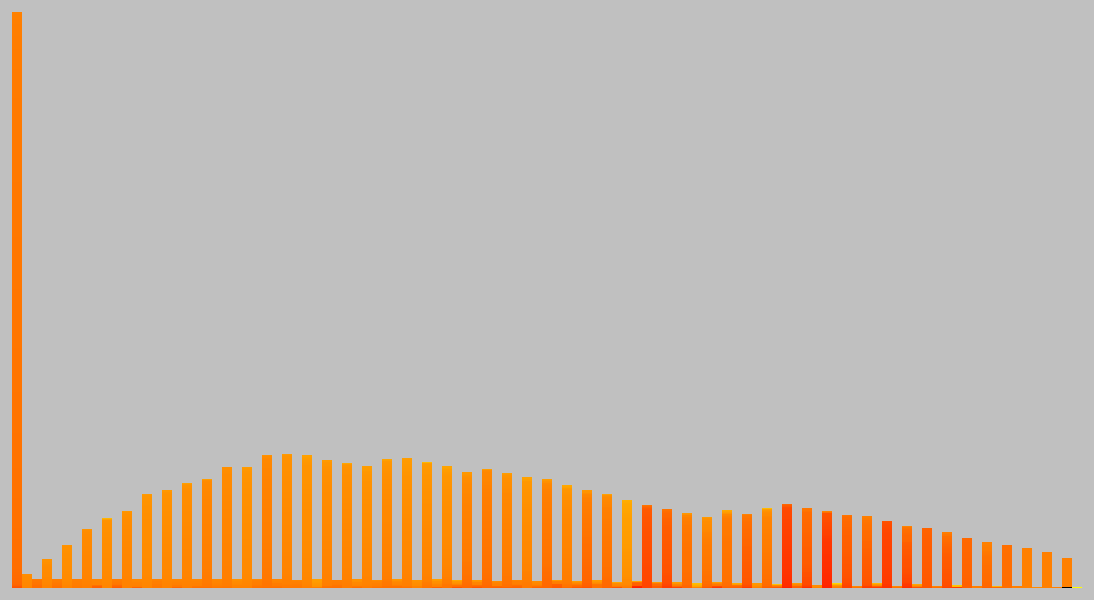
Actions/turn
Table: branching factor per turn, based on a single representative* game. (* Representative in the sense that it is close to the mean game length.)
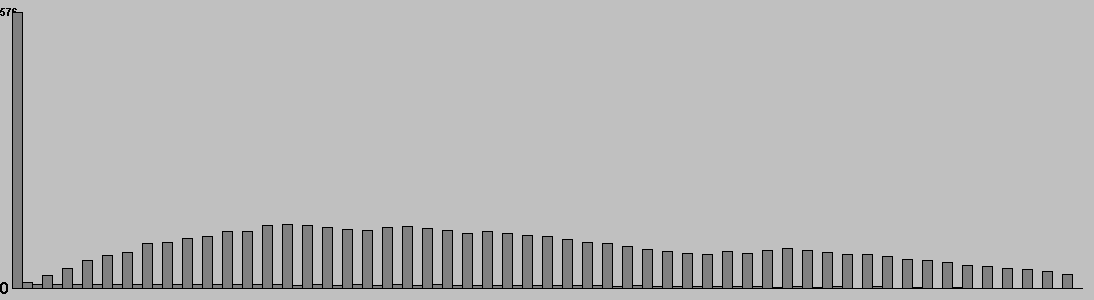
Action Types per Turn
This chart is based on a single representative* game, and gives a feel for the types of moves available throughout that game. (* Representative in the sense that it is close to the mean game length.)
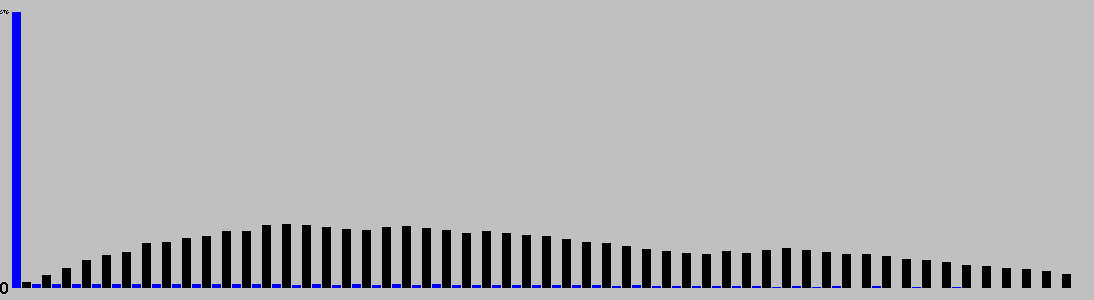
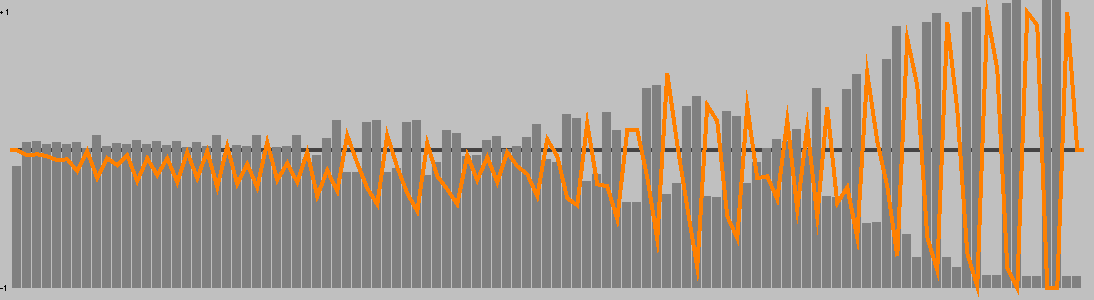
This chart shows the best move value with respect to the active player; the orange line represents the value of doing nothing (null move).
The lead changed on 19% of the game turns. Ai Ai found 5 critical turns (turns with only one good option).
Position Heatmap
This chart shows the relative temperature of all moves each turn. Colour range: black (worst), red, orange(even), yellow, white(best).
Good/Effective moves
Measure
All players
Player 1
Player 2
Mean % of effective moves
37.51
41.10
33.99
Mean no. of effective moves
23.55
23.98
23.13
Effective game space
10^77.89
10^39.87
10^38.02
Mean % of good moves
33.57
10.21
56.51
Mean no. of good moves
21.97
8.17
35.52
Good move game space
10^67.01
10^16.90
10^50.11
These figures were calculated over a single game.
An effective move is one with score 0.1 of the best move (including the best move). -1 (loss) <= score <= 1 (win)
A good move has a score > 0. Note that when there are no good moves, an multiplier of 1 is used for the game space calculation.
Quality Measures
Measure
Value
Description
Hot turns
83.18%
A hot turn is one where making a move is better than doing nothing.
Momentum
26.17%
% of turns where a player improved their score.
Correction
43.93%
% of turns where the score headed back towards equality.
Depth
4.03%
Difference in evaluation between a short and long search.
Drama
0.06%
How much the winner was behind before their final victory.
Foulup Factor
42.99%
Moves that looked better than the best move after a short search.
Surprising turns
1.87%
Turns that looked bad after a short search, but good after a long one.
Last lead change
75.70%
Distance through game when the lead changed for the last time.
Decisiveness
6.54%
Distance from the result being known to the end of the game.
These figures were calculated over a single representative* game, and based on the measures of quality described in "Automatic Generation and Evaluation of Recombination Games" (Cameron Browne, 2007). (* Representative, in the sense that it is close to the mean game length.)
Openings
Moves
Animation
M-Medium-g7,g7-g6,M-Light-g7
S-Light-g7,g7-c7,M-Medium-g7
M-Medium-g3,g3-e5,L-Dark-g3
Opening Heatmap
Colour shows the success ratio of this play over the first 10moves; black < red < yellow < white.
Size shows the frequency this move is played.
Unique Positions Reachable at Depth
0
1
2
3
4
5
1
576
8766
83610
1482966
14077170
Note: most games do not take board rotation and reflection into consideration. Multi-part turns could be treated as the same or different depth depending on the implementation. Counts to depth N include all moves reachable at lower depths. Inaccuracies may also exist due to hash collisions, but Ai Ai uses 64-bit hashes so these will be a very small fraction of a percentage point.
Shortest Game(s)
No solutions found to depth 5.
Puzzles
Puzzle
Solution
Heights to win in 8 moves
Weak puzzle selection criteria are in place; the first move may not be unique.